Uniswap Smashes Records: v4 Hits $1B TVL Amid $110B Volume Frenzy

DeFi's liquidity king flexes its muscles again—Uniswap v4 just bulldozed past the $1B total value locked (TVL) milestone while cumulative trading volume screams past $110B. Traders are piling in like it’s a Black Friday sale on leverage.
Resistance? More like a speed bump. The protocol’s latest iteration keeps eating market share while traditional finance still struggles with spreadsheets and settlement delays. (Bankers, maybe try keeping up?)
What’s fueling the surge? Smarter pools, hook-driven customization, and that sweet, sweet yield chasing—because nothing screams 'bull market' like liquidity providers doing backflips into volatile asset pairs.
One thing’s clear: When Uniswap sneezes, the entire DEX ecosystem catches a cold. Now if only Wall Street could figure out what a 'wallet' is.
Uniswap v4 on-chain metrics surge
The ongoing expansion of Uniswap v4 supports the move. The cumulative trading volume has surpassed $110 billion, and the total value locked has crossed $1.03 billion. The 30-day decentralized exchange volume is currently $26 billion, based on data from DeFiLlama.
Most activity is concentrated on Unichain, Uniswap’s native LAYER 2, which accounts for roughly 75% of all trades. Ethereum’s share has fallen below 20%.
More than 2,500 liquidity pools have deployed custom Hooks. Protocols such as Bunni and EulerSwap have each surpassed $1 billion in volume. Unichain’s low fees and fast block times have helped make it the third-largest layer 2 by usage.
Uniswap v4 launched on January 31 across 10 networks, including Ethereum (ETH), Arbitrum (ARB), Base, and BNB Chain (BNB). July upgrades included expanded smart wallet support, cross-chain integrations with Hyperbridge and LayerZero (ZRO), and over 640 million total swaps processed.
Uniswap technical analysis
UNI is trading at $11.03, below its upper Bollinger Band at $11.63, and just below its most recent peak of $11.30. At 71.30, the relative strength index indicates that the market is overbought. The 20-day SMA of $9.73, which currently serves as support, is still well above the price.
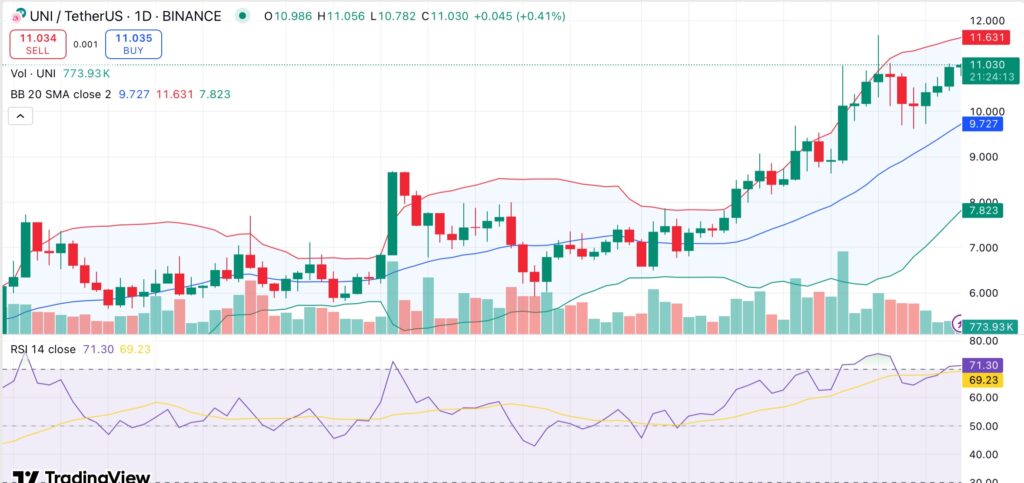
UNI’s pattern points to a staircase-like upward MOVE with slight consolidations, which is common with strong uptrends. However, short-term profit-taking could result from an RSI above 70 for a sustained period without consolidation.
The uptrend might continue as long as UNI remains above important moving averages and volume sustains the bullish momentum. The next resistance level is close to $12 if UNI breaks above $11.30. If the market continues to rise above this level, it may eventually reach $13–$14.
On the downside, a pullback toward $9.70–$10 could be triggered by a rejection at resistance when the RSI cools off, but if it holds, the structure WOULD remain bullish.
