Bitcoin Shatters 2017 & 2021 Cycles in 2025 Rally—Is This the Ultimate Bull Signal?

Bitcoin isn’t just breaking records—it’s rewriting the playbook. The 2025 surge defies the predictable boom-bust patterns of 2017 and 2021, leaving traders scrambling for answers.
Why this cycle’s different: Institutional FOMO or just Wall Street catching up late to the party? The usual indicators—halving cycles, ETF inflows, on-chain metrics—are flashing green, but skeptics whisper ‘irrational exuberance.’
The make-or-break factor: Liquidity. With central banks still drunk on money printers, BTC’s acting less like ‘digital gold’ and more like a gamma-squeezed meme stock—just with better PR.
Pro tip: Watch the leverage flushouts. Every 20% dip gets bought faster than a VC’s second yacht. Whether that’s strength or stupidity depends on your risk tolerance—and how much you trust the ‘number go up’ cult.
Bottom line: History rhymes until it doesn’t. This time might actually be different… or it’s just another bubble inflated by hedge funds who finally read the Bitcoin whitepaper. Place your bets.
Bitcoin may be approaching an overheated bull run
Another CryptoQuant model mentioned by Arab Chain, the bitcoin Bull and Bear Market Cycle indicator, shows that market is in an overheated bullish phase. This has historically led to short-term spikes followed by corrections.
Long-term trend indicators such as the 30- and 365-day moving averages are still bullish, but Arab Chain advises that new buyers might be better off holding off until there is a more distinct pullback. As of this writing, Bitcoin is up 12% for the month at $117,830, a 4% retracement from its peak.
Bitcoin technical analysis
Bollinger Bands show Bitcoin trading in the upper range, with the upper band at $124,041 and the middle band near $115,955, a strong area of support. The relative strength index sits just under 60, suggesting neutral momentum. However, shorter-term moving averages are flashing sell, with the 10-day EMA and SMA both above the current price.
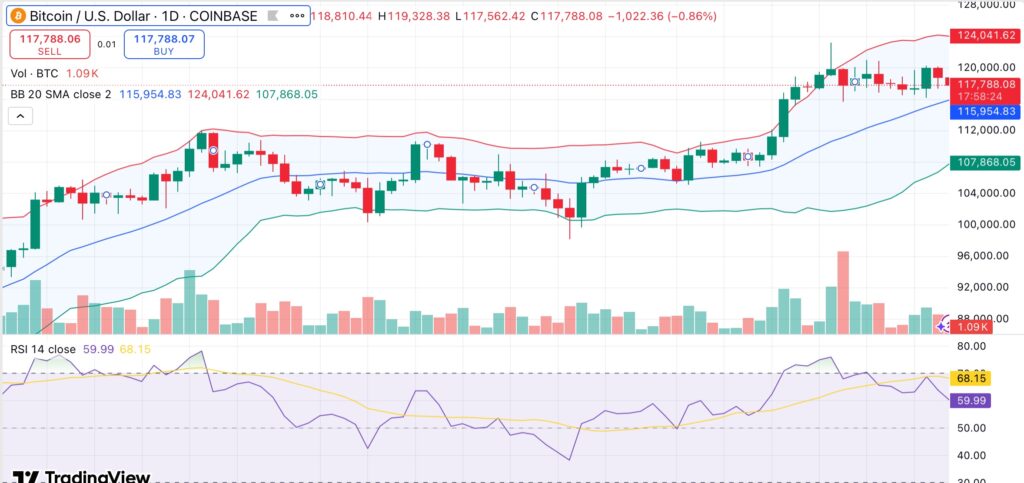
The longer-term indicators are still bullish. The continuous upward trend is supported by the positive stacking of the 50-, 100-, and 200-day moving averages. The MACD and Momentum indicators are short-term bearish, suggesting possible drops but no reversal.
If Bitcoin reclaims $120,000 and pushes through the upper Bollinger Band at $124,041, a retest of the all-time high at $122,838, and even a MOVE to new highs, is possible. Bitcoin may test deeper support levels close to $111,000 if it drops below $115,000.
A break below that WOULD indicate the start of a more significant correction, especially if exchange flows start to increase.
