FARTCOIN Surges Toward $2.28 as Bulls Target All-Time High Revival

FARTCOIN isn't just blowing hot air—it's gunning for a 40% rally toward $2.28 this week as traders pile into the meme coin's comeback narrative.
### The Setup: From Toilet Humor to Trading Charts
After three months of sideways action, FARTCOIN's breakout past $1.92 resistance has technical analysts dusting off their 'to the moon' memes. The 24-hour RSI hasn't hit overbought territory since January's ill-fated 'Diamond Hands' rally.
### Liquidity Hunt: Where the Smart Money's Sniffing
Order book data shows concentrated buy walls at $2.10—exactly where institutional algo traders parked stop-loss orders during March's 'crypto spring' pullback. Retail traders appear to be front-running the move, because nothing says 'financial sophistication' like chasing a coin named after bodily functions.
### The Punchline
Whether this is the start of a legitimate uptrend or just another pump before the inevitable dump, one thing's clear: in crypto, even joke assets get second acts. Just ask the DOGE millionaires... assuming they didn't paper-hand their bags in 2022.
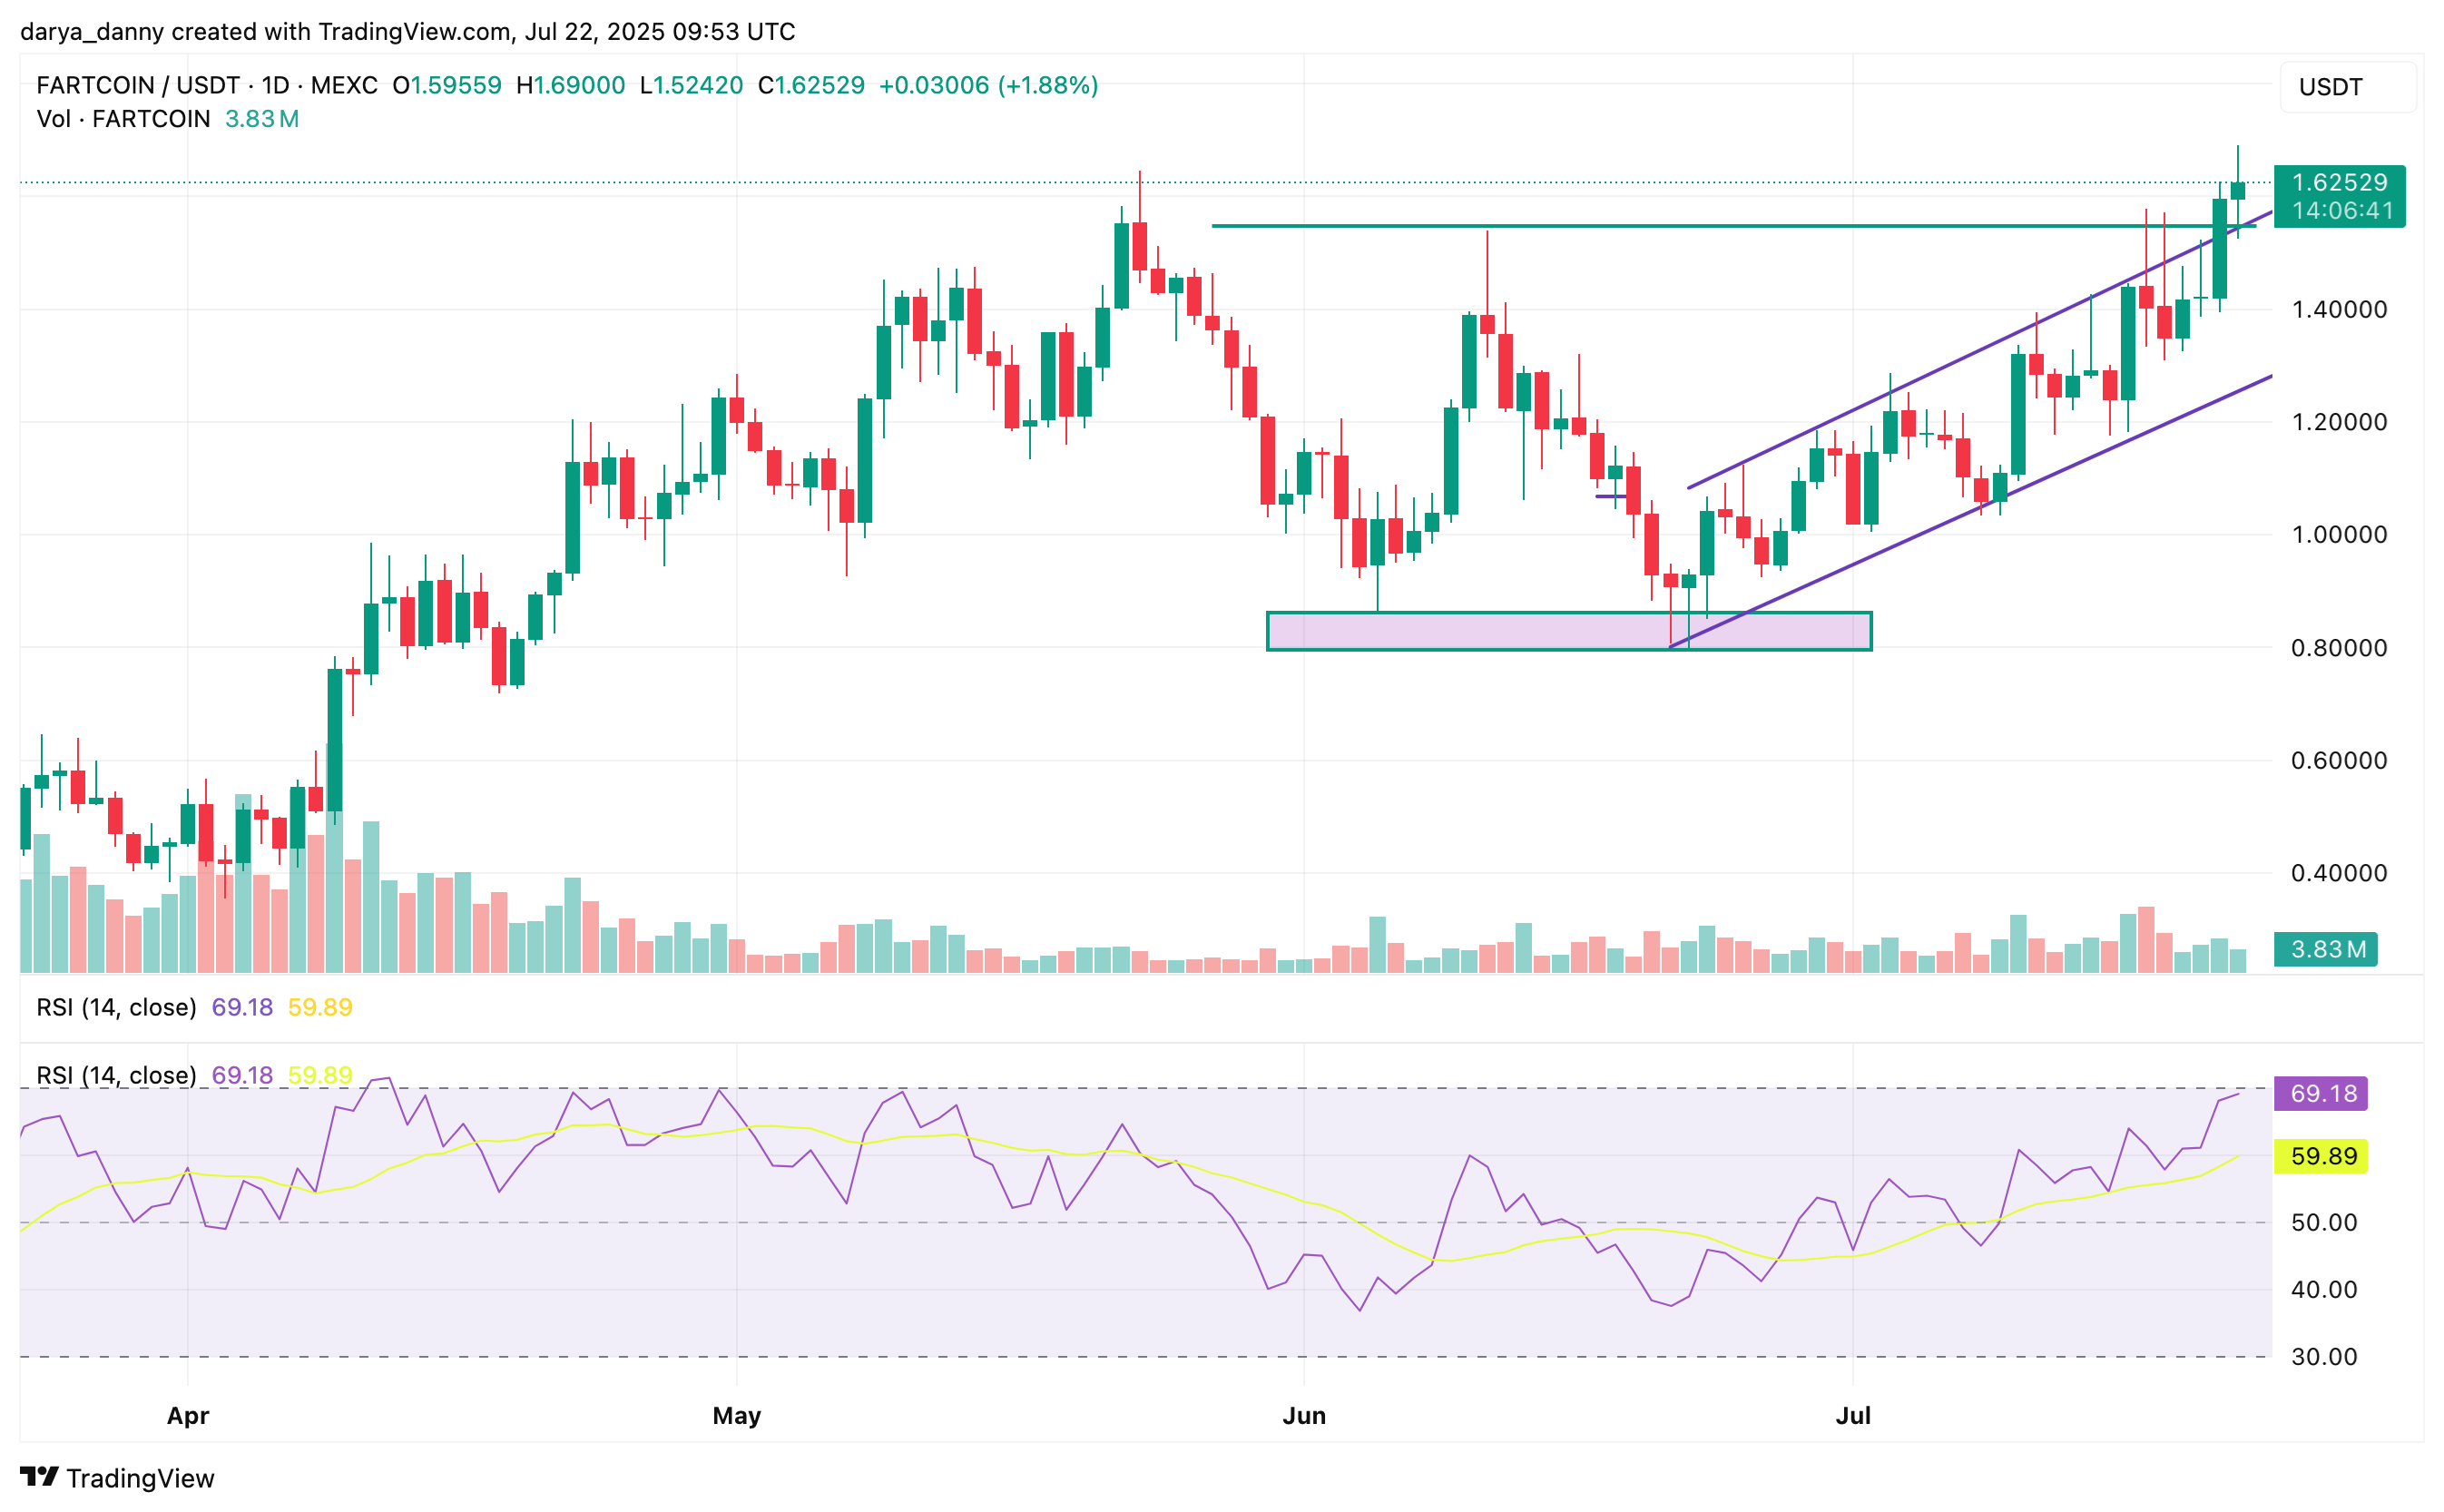 Source: TradingView
Additionally, yesterday’s candle breached the neckline at $1.54, confirming the breakout of a potential double bottom pattern, with the two troughs formed at $0.86 and $0.80. Though the bottoms are not perfectly aligned — separated by about 7% — the pattern may still be valid as the memecoin‘s price held a similar support zone and showed clear bullish rejection on both occasions. If so, the breakout opens the door to a measured MOVE target of $2.28, calculated by adding the height of the pattern ($0.74) to the neckline level.
However, the RSI is currently at 69, approaching overbought territory, which signals a potential pullback or consolidation before the next leg higher. Immediate support is found at the former upper trendline of the ascending channel, which aligns with the neckline of the double bottom pattern in the $1.52–$1.54 range.
Below that, the next key support lies at $1.30–$1.32 — the most recent higher low prior to the breakout, and roughly the midpoint of the ascending channel. In the case of a deeper correction, strong structural support is expected at the lower trendline around $1.25, which could help contain further downside.

Log in to Reply
Log in to comment your thoughtsComments
Related Articles
|Square
Get the BTCC app to start your crypto journey
Get started today Scan to join our 100M+ users