XRP Stalls as Ripple ETF Charges Toward $500M AUM – Can It Catch Up?

Ripple's ETF rockets toward half a billion while XRP price action snoozes. Wall Street's latest crypto cash grab hits warp speed—meanwhile, the 'people's coin' watches from the sidelines.
When institutions move, they don't wait for retail. The Ripple ETF's blistering growth proves crypto's old guard is getting left behind by financialization 2.0. XRP loyalists keep chanting 'utility' as the smart money stacks ETFs instead.
Here's the brutal truth: liquidity flows where the barriers are lowest. And right now, that's not your grandma's crypto wallet—it's BlackRock's balance sheet. The $500M milestone isn't just a number—it's a warning shot across the bow of every 'decentralized' project still begging for regulatory hugs.
81st biggest asset globally
Ripple’s year-to-date gains are 66% and its market capitalization is at about $204 billion. As for its fully diluted valuation, it is over $300 billion.
It has grown into the 81st biggest asset globally.
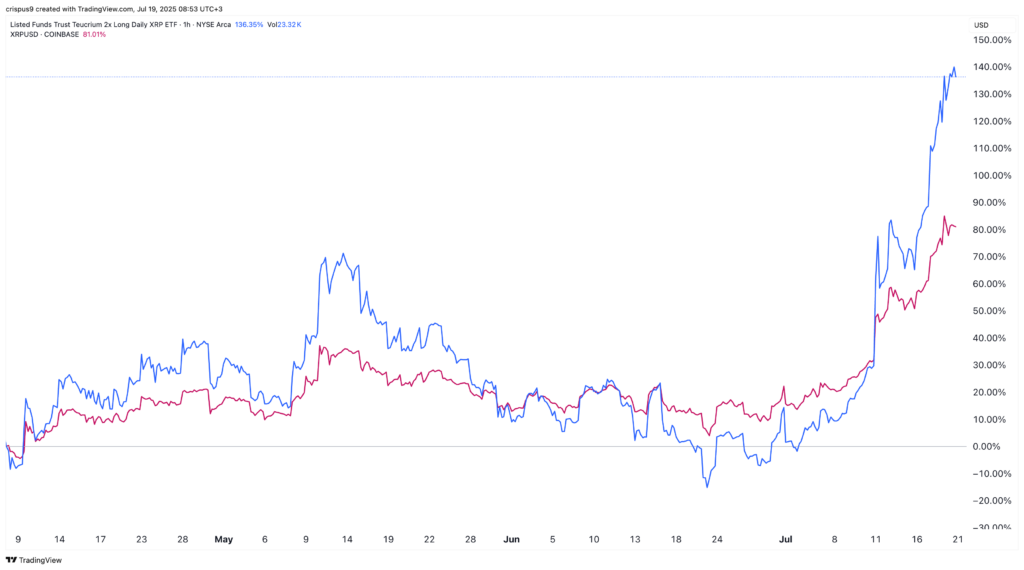
But the XXRP fund has actually outperformed XRP. Why? Unlike other popular crypto ETFs, it is a leveraged fund that seeks to generate daily returns of 2x the performance of XRP price. If XRP increases by 1%, the XXRP stock will rise by 2%.
It is common for some leveraged ETFs to beat their underlying asset. For example, the leveraged ProShares UltraPro QQQ has jumped by 240% over the last five years, while the Nasdaq 100 has gained 126% during the same period.
XRP jumped as investors celebrated the signing of the GENIUS Act, which will support its Ripple USD stablecoin. Data showsthat its market cap has jumped from zero in December last year to over $517 million today. It is also slowly closing in on PayPal’s PYUSD.
XRP price technical analysis
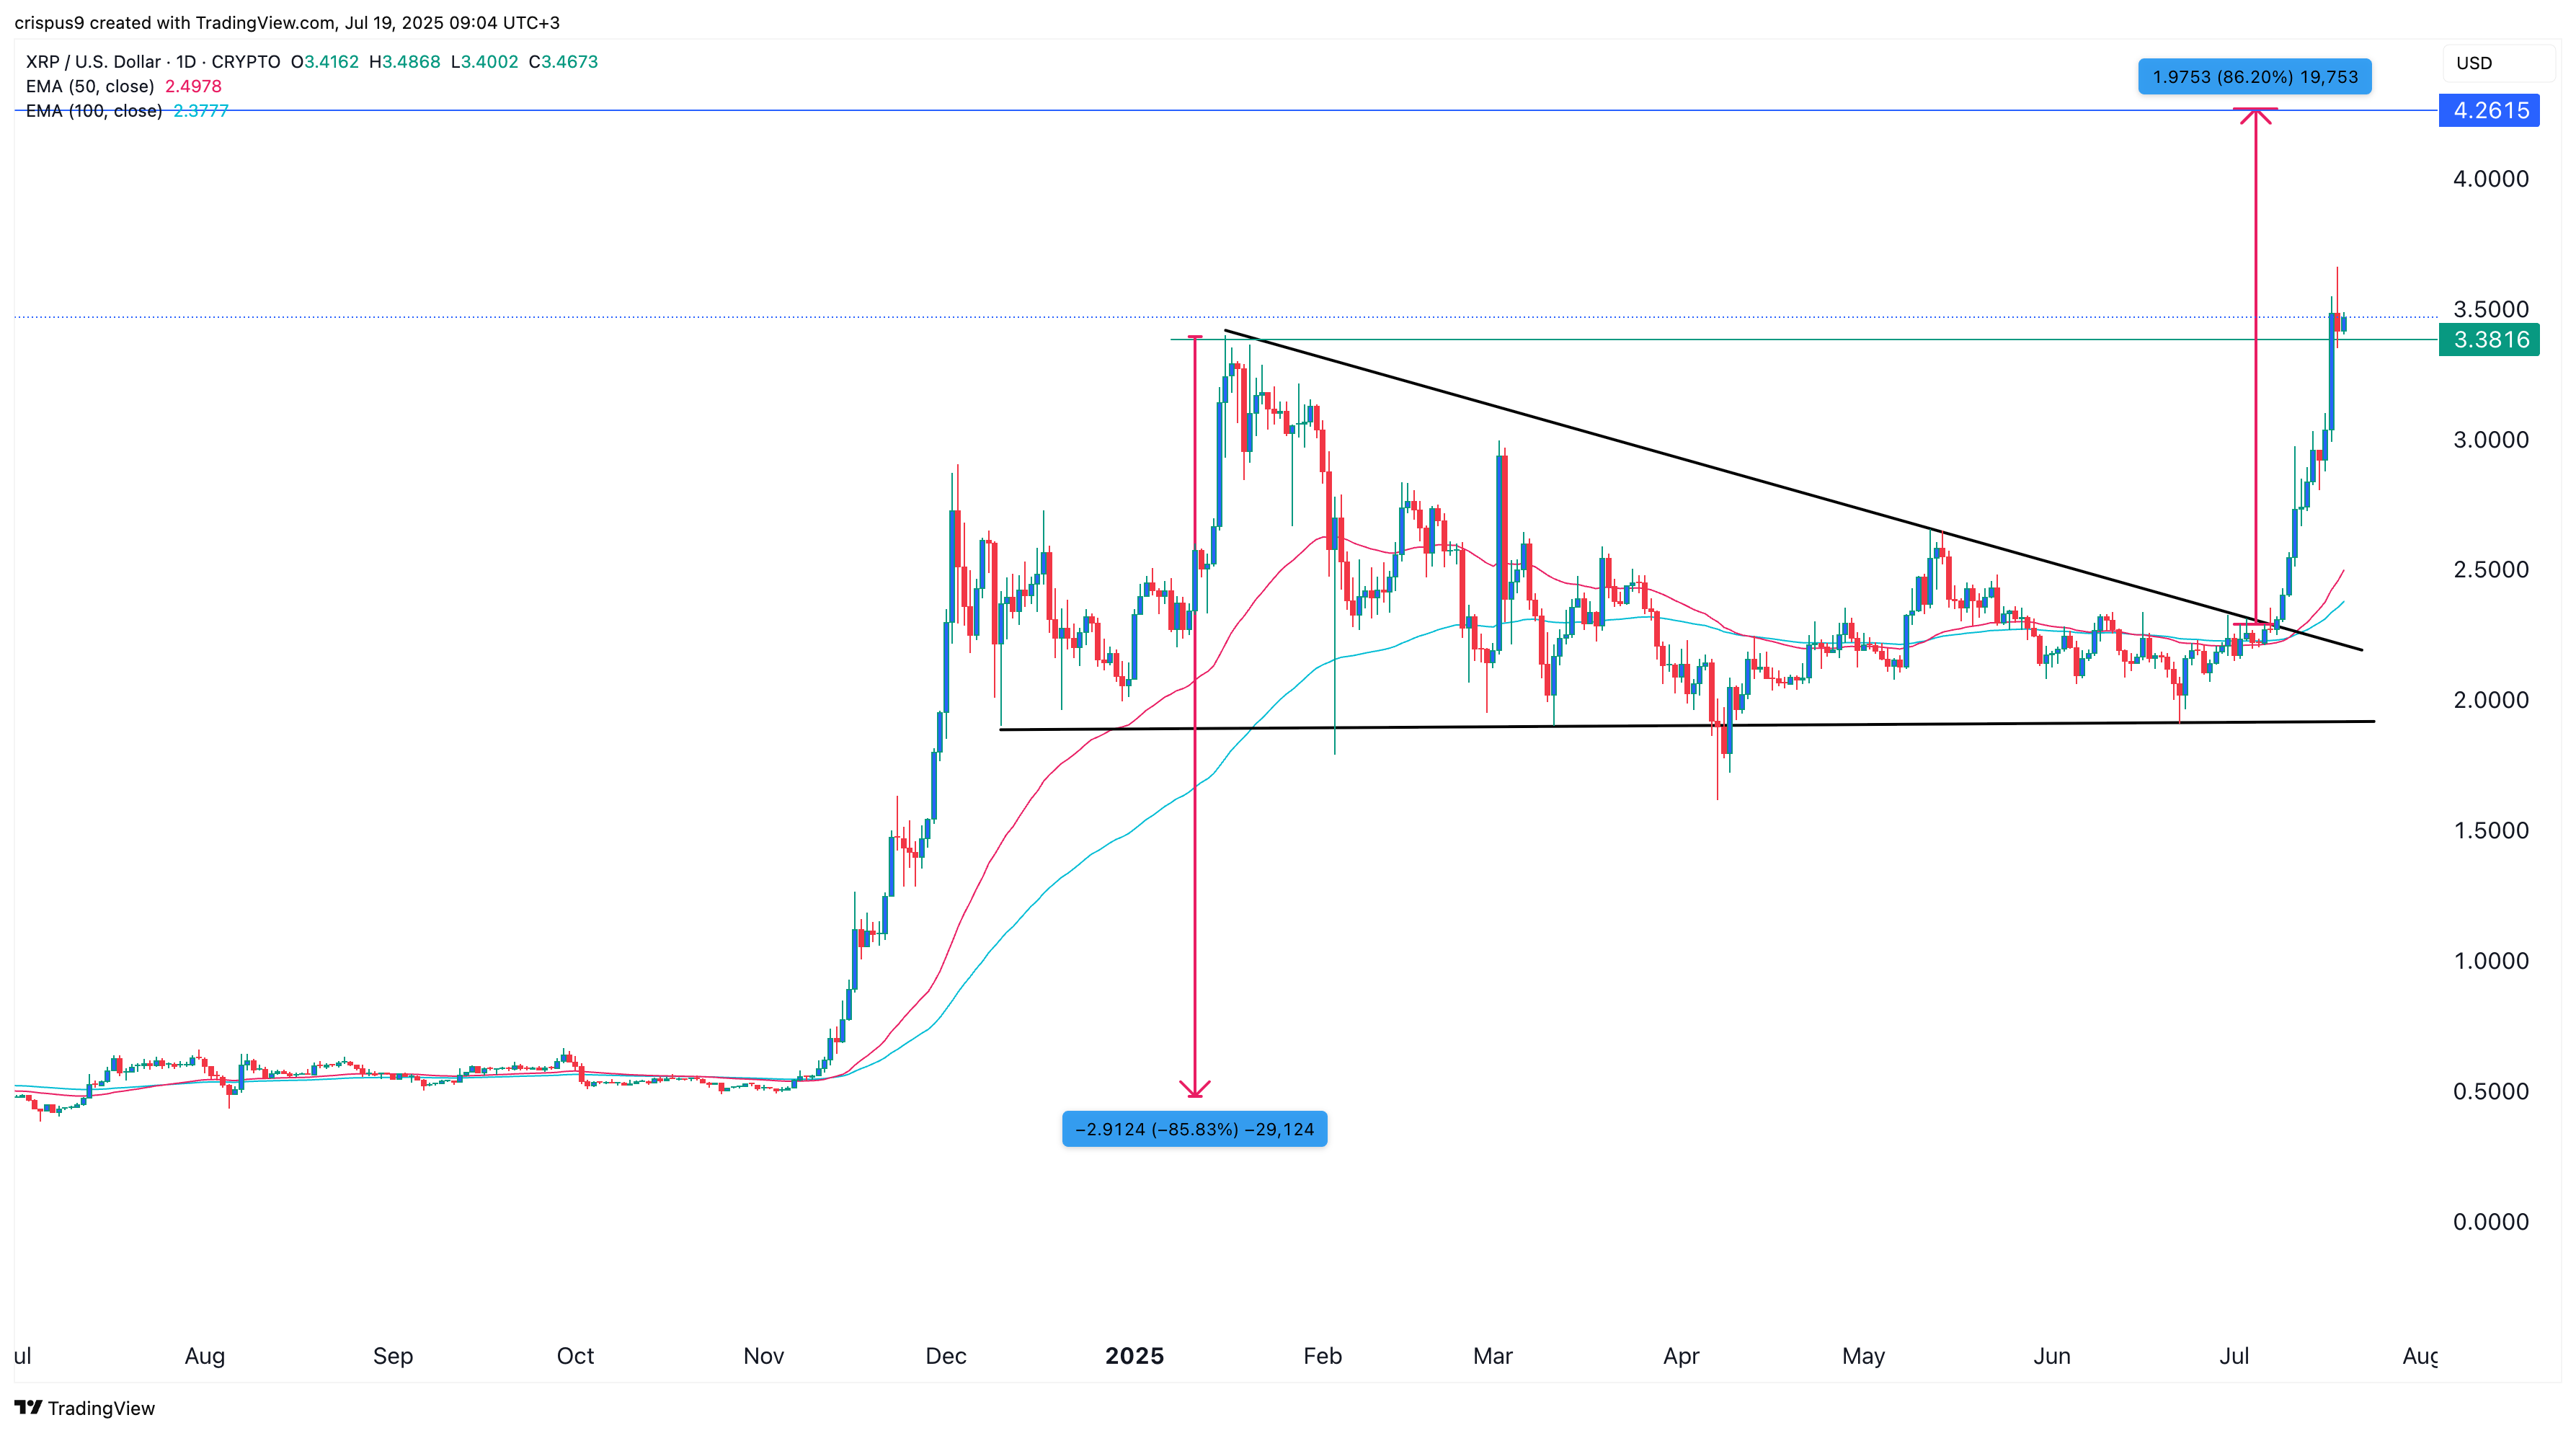
The daily timeframe shows that the xrp price has been in a strong bull run in the past few weeks. It broke out above the upper side of the symmetrical triangle that was part of the bullish pennant pattern.
XRP then crossed the important resistance point at $3.38, the highest swing on January 16. It has remained above the 50-day and 100-day moving averages, while most oscillators, such as the RSI and the MACD, have pointed upward.
The height of the flagpole section of the bullish pennant was 86%. Therefore, measuring the same distance from the breakout point gives it a target price of $4.2615.
