🚀 PENGU Soars Past Cup-and-Handle Pattern – 75% Upside Targets in Sight

Breakout alert: PENGU shatters resistance with textbook technicals.
The Setup:
A 6-week consolidation phase formed a near-perfect cup-and-handle pattern—the kind that makes chartists drool. Now the handle’s broken, and volume’s spiking like a caffeinated trader during a bull run.
The Target:
Technical projections suggest a 75% climb from current levels. Of course, in crypto-land, ‘projections’ are just educated guesses wrapped in hopium—but hey, even broken clocks are right twice a day.
Why It Matters:
Cup-and-handle breakouts often precede explosive moves. This one’s playing out with eerie precision, though as any seasoned degen knows, ‘precision’ lasts until the next whale decides to dump.
Watch those support levels. And maybe keep one finger hovering over the sell button—just in case this turns into another ‘buy the rumor, sell the news’ circus.
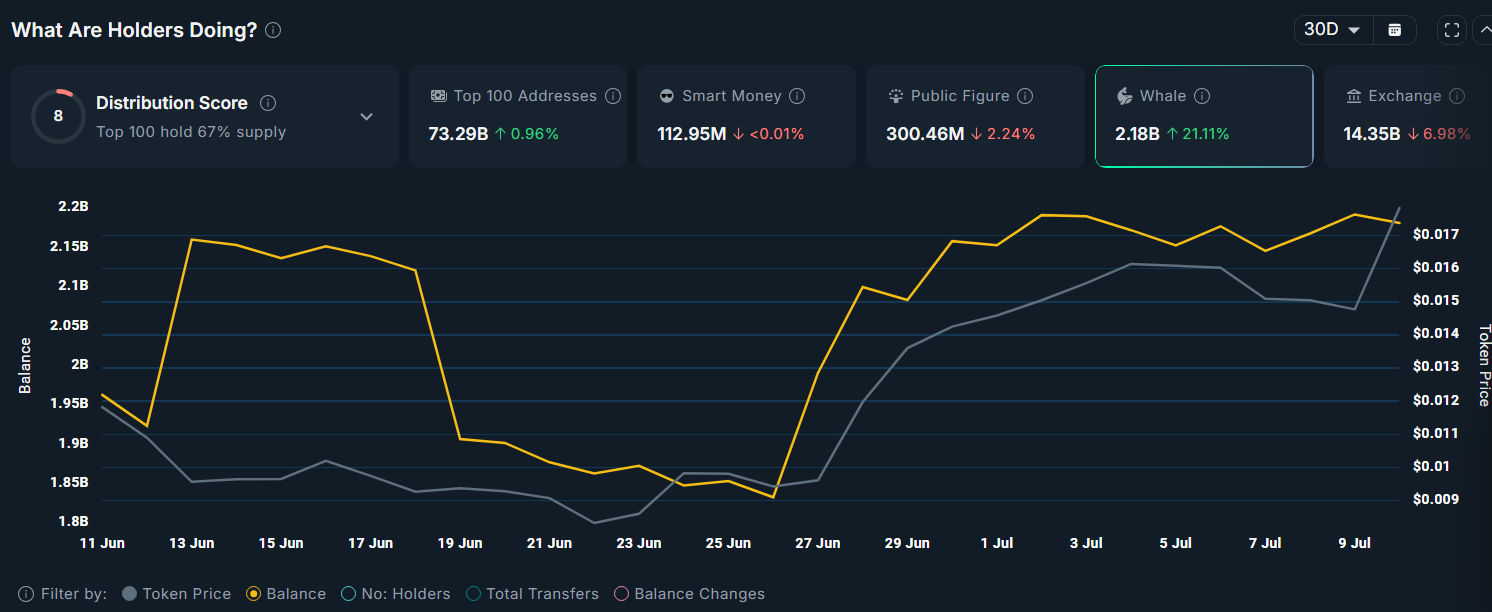 Source: Nansen
Simultaneously, PENGU’s circulating supply on exchanges has declined notably, from 15.6 billion on June 12 to 14.3 billion as of this week. A reduction in exchange reserves is typically interpreted as bullish, as it indicates reduced selling pressure and a higher likelihood of tokens being held in cold storage or long-term wallets.
Further reinforcing the bullish case, data from CoinGlass shows that PENGU’s weighted funding rate turned positive on derivatives exchanges for the first time since July 1. A positive funding rate indicates that long positions are paying shorts, typically reflecting a shift toward bullish market sentiment and increased demand for leverage on the long side.
PENGU price forms a cup and handle pattern
The daily chart for PENGU reveals a clear cup-and-handle pattern formation, a historically reliable bullish continuation setup. The token bottomed at $0.0037 in March before rebounding to a local high of $0.0175 in May, creating a rounded base followed by a brief consolidation phase, the “handle” portion of the pattern.
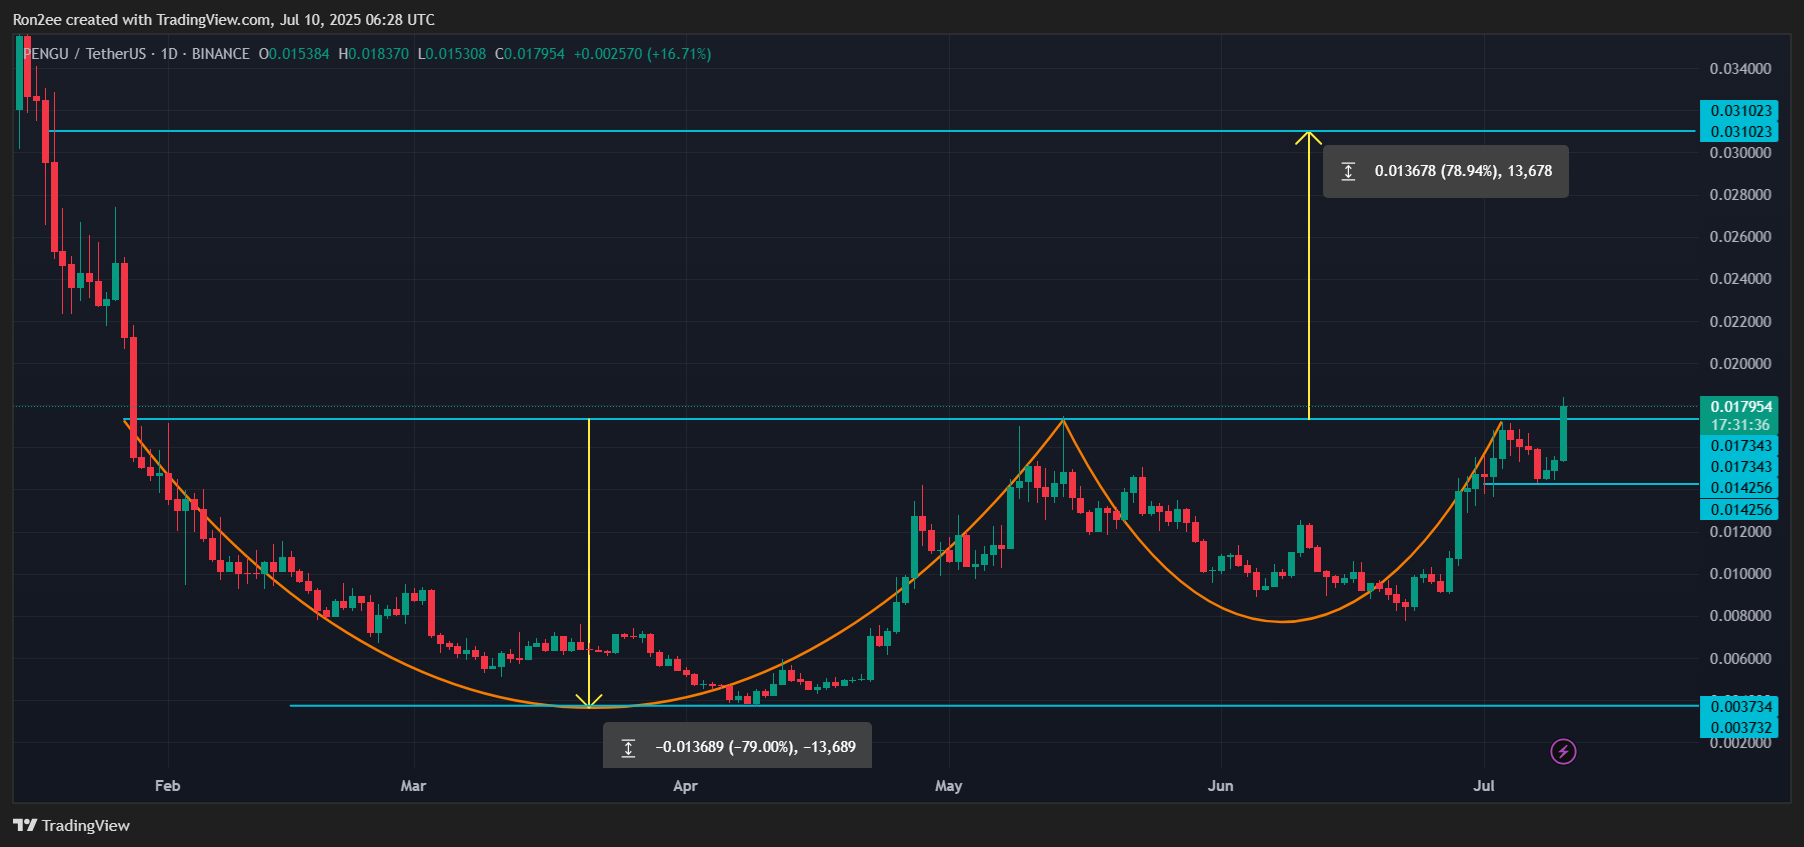
The cup-and-handle formation is defined by two distinct price swings, an initial drop and recovery forming the “cup,” followed by a smaller, shallower pullback that shapes the “handle.”
It has since broken above the neckline resistance of this structure, which usually signals the start of a potential breakout.
The vertical distance between the cup’s upper resistance and the March low measures approximately 79%. Applying this projected move from the breakout point suggests a potential upside target NEAR $0.0318.
This would represent a gain of around 75% from the current price level. However, this bullish forecast would be invalidated if the token drops below the support level at $0.0142.
At press time, PENGU remains significantly below its December 2024 high of $0.06845, leaving substantial room for upside if bullish momentum continues.
Disclosure: This article does not represent investment advice. The content and materials featured on this page are for educational purposes only.
