Ethereum’s Harmonic Pattern Hints at a Surge to $3,200 – Time to Buy?

Ethereum bulls are licking their chops as a classic harmonic pattern flashes buy signals. The setup suggests a potential sprint to $3,200—just as traders start questioning if 'institutional adoption' means hedge funds finally read the whitepaper.
The technicals don't lie: ETH's price action is tracing a textbook bullish reversal. When these patterns confirm, they tend to deliver explosive moves. Of course, in crypto, 'textbook' could mean getting rug-pulled by a meme coin five minutes later.
Market watchers note the $3,200 target aligns with key liquidity zones. That's trader-speak for 'where the leveraged longs will get liquidated if this goes south.' But with ETH fundamentals stronger than a Bitcoin maxi's confirmation bias, the upside looks real.
Just remember: in a market where 'fundamental analysis' sometimes means staring at a monkey JPEG, even harmonic patterns deserve a healthy dose of skepticism. The chart says buy—your margin account might disagree.
Three key technical points
- Ethereum is facing resistance at $2,590, a zone confluent with the 0.618 Fibonacci level and channel midpoint.
- A harmonic pattern (Butterfly) is potentially forming, requiring a corrective leg C before a bullish leg D continuation.
- High time frame support at $2,226 could be the target of a healthy pullback to complete leg C.
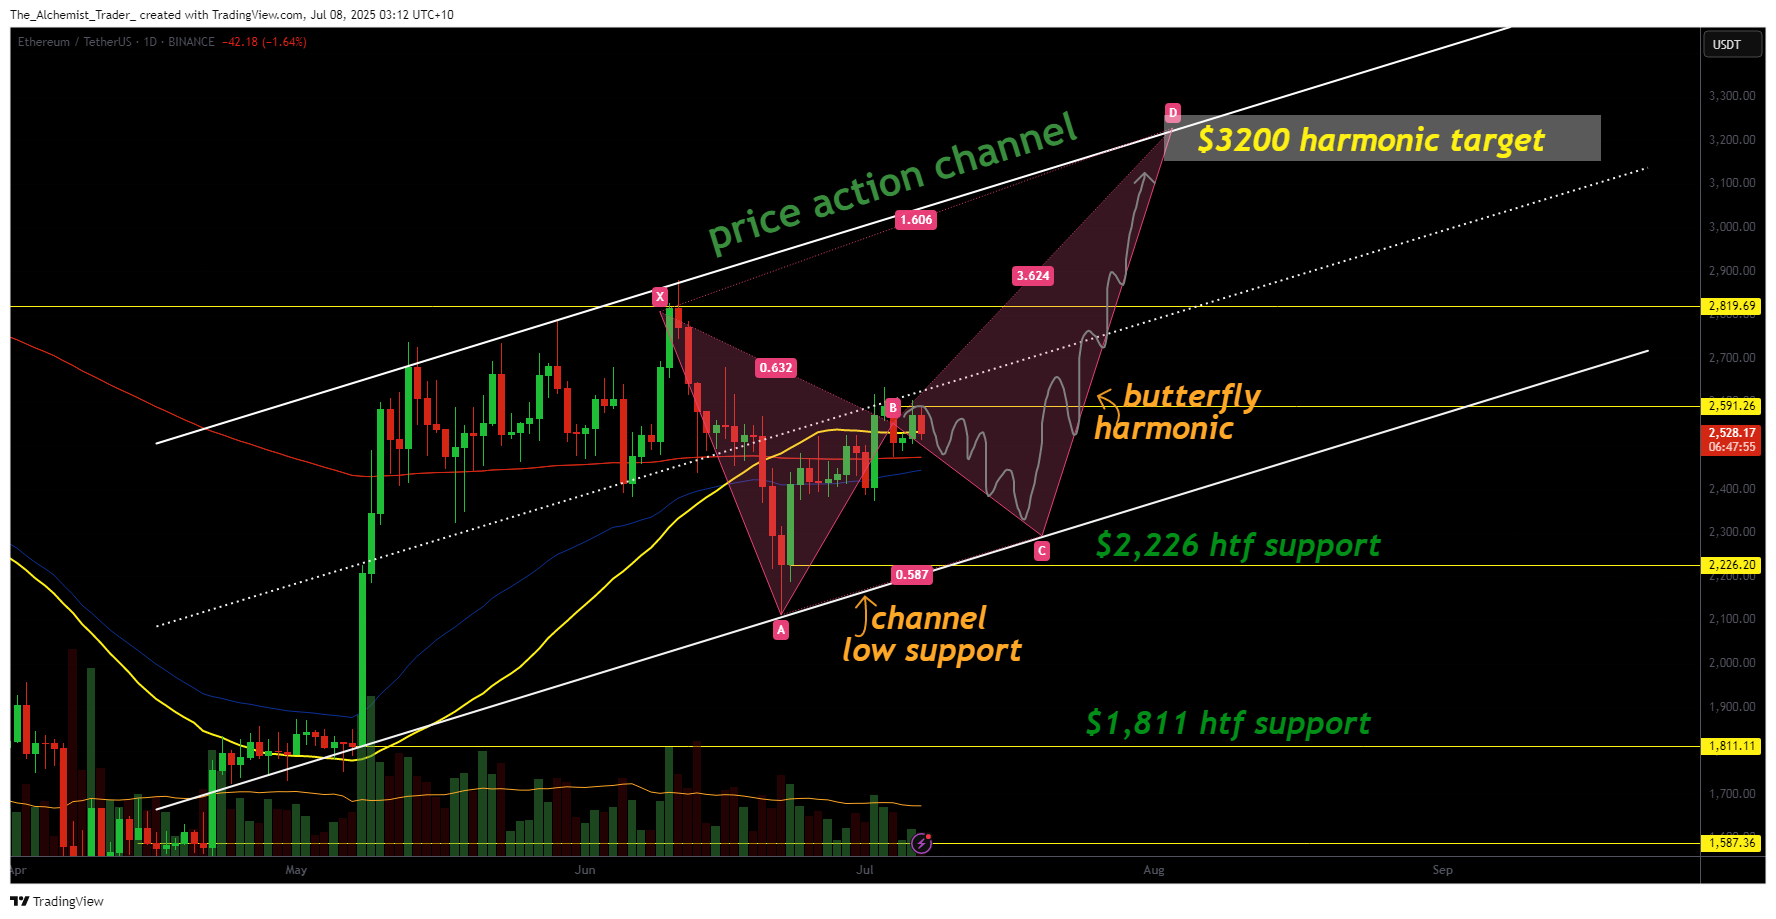
Ethereum has recently rallied into the $2,590 zone, a region marked by strong historical resistance and multiple layers of technical confluence. This level is not only a psychological round number but also aligns with the 0.618 Fibonacci retracement drawn from the previous high to the most recent swing low at $1,920. Additionally, this area coincides with the midpoint of the broader Fibonacci-based price channel that ethereum has been trading within.
This confluence strengthens the case that Ethereum may temporarily stall at this level before resuming its upward trend. Notably, a potential Butterfly harmonic pattern is emerging within the current structure. For the setup to remain valid, a corrective leg C must form, implying a possible retracement toward the $2,226 region, where high time frame and channel support converge.
If price revisits this level and holds, it WOULD confirm the formation of leg C and set the foundation for a bullish continuation into leg D. The projected target for leg D aligns with the $3,200 area, the upper boundary of the price channel and a key high time frame resistance zone.
Volume and structure will be critical in validating this scenario. Currently, volume remains muted, indicating that any breakout from this resistance level would require a notable surge in buyer interest to be sustainable.
What to expect in the coming price action
Ethereum remains bullish on higher time frames, but a pullback from $2,590 would be both expected and technically healthy. A move toward $2,226 could complete the harmonic structure, paving the way for a continuation toward $3,200, assuming support holds and volume picks up on the next leg higher.

Log in to Reply
Log in to comment your thoughtsComments
Related Articles
|Square
Get the BTCC app to start your crypto journey
Get started today Scan to join our 100M+ users