Bitcoin’s $120K Make-or-Break Moment: The Q3 Trendline Showdown

Bitcoin's flirting with a historic stress test—and the next eight weeks could decide whether it's headed for glory or another 'crypto winter' sob story.
The $120K Litmus Test
That stubborn trendline isn't just technical noise. It's the bull market's last stand—break through, and we're talking institutional FOMO at levels that'd make BlackRock blush. Fail? Cue the 'overleveraged retail exit' memes.
Q3's Do-or-Die Setup
July's liquidity crunch meets Bitcoin's habitual volatility. Add ETF flows playing tug-of-war with Mt. Gox repayments, and you've got a recipe for either fireworks or faceplant.
Wall Street's 'digital gold' narrative gets its reality check—because nothing says 'store of value' like 20% hourly swings. Place your bets.
Key technical points
- $120,000 Dynamic Resistance: Multi-year descending trendline from April 2021, respected in both 2021 and 2024.
- $73,000 High Time Frame Support: Range low support acting as the major pivot zone in the event of a rejection.
- Historical Behavior: Each retest of this resistance has led to major long-term consolidations or corrections.
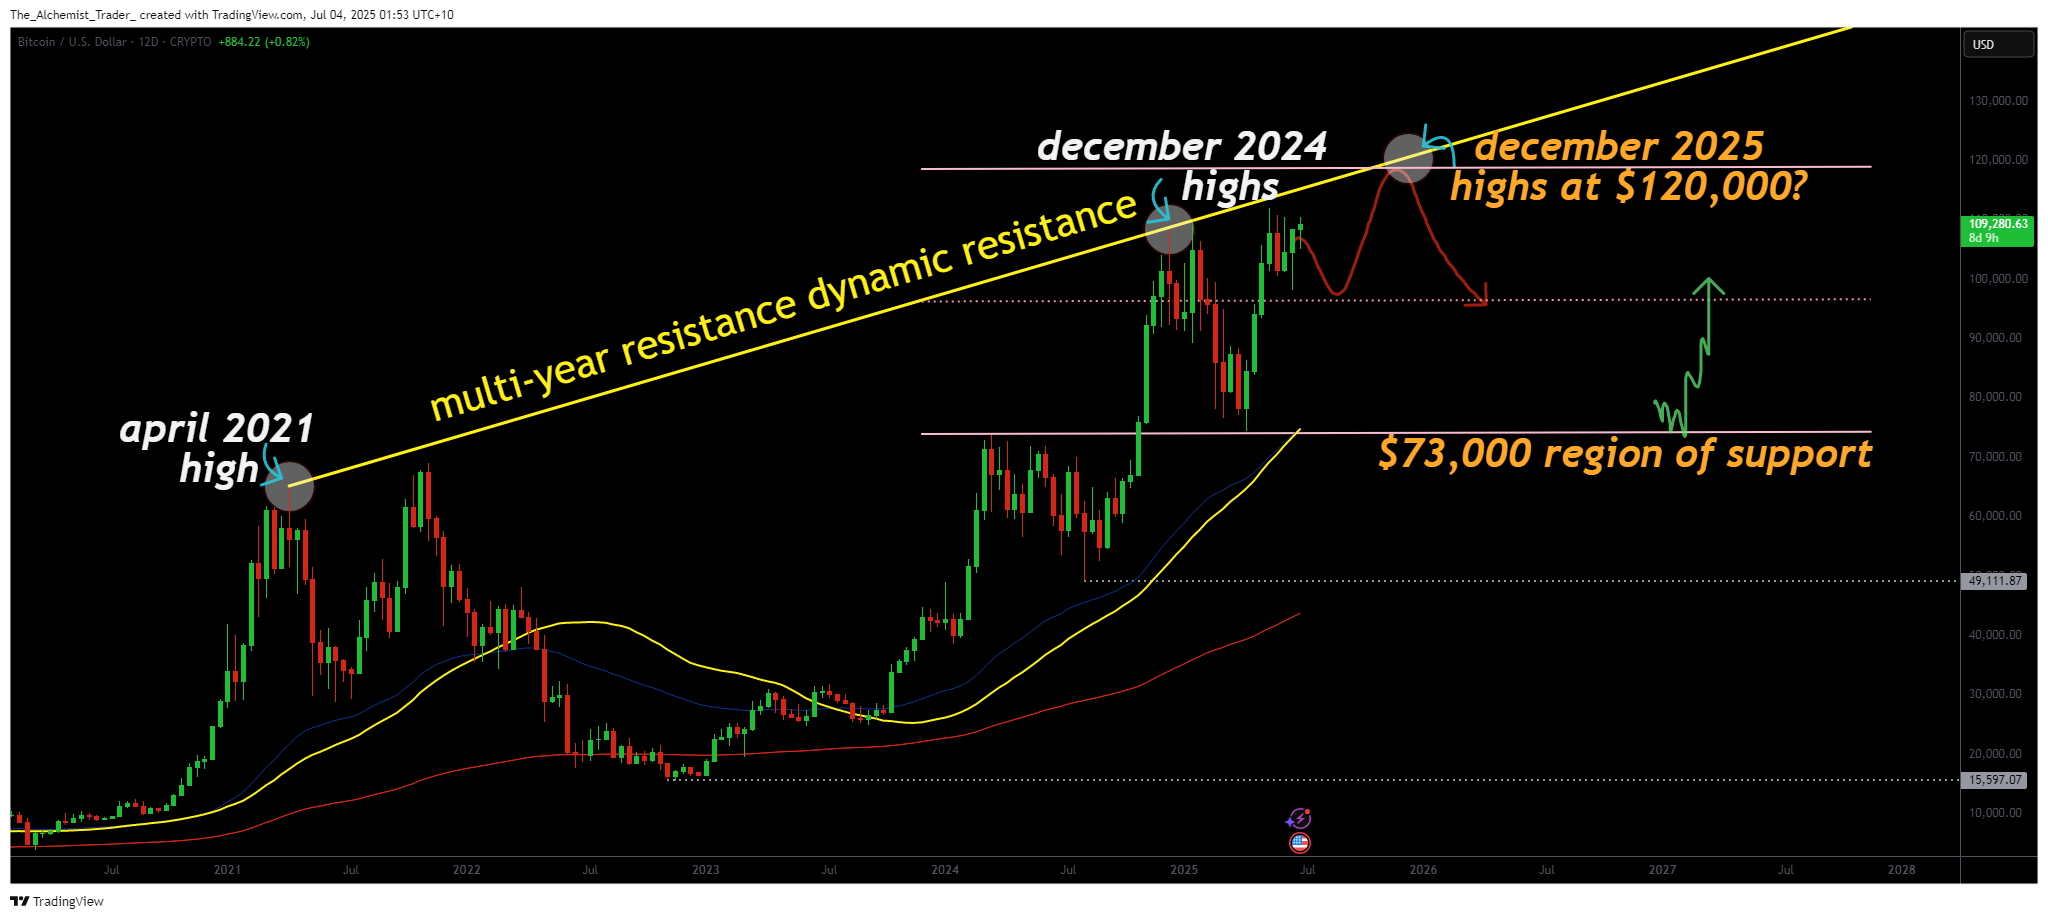
The dynamic resistance currently hovering around the $120,000 mark has historical significance. It was first established in April 2021, when Bitcoin topped out during the previous bull market. The second major interaction occurred in December 2024, where BTC again tested this level and failed to break through, forming a precise rejection wick at the trendline. These repeated interactions affirm the strength and technical relevance of this resistance.
Now, in mid to late 2025, bitcoin is once again grinding toward this region. While this approach hasn’t yet triggered a breakout, the fact that price has maintained a bullish structure while approaching it suggests potential for a high-stakes breakout, or yet another rejection that could reintroduce range-bound trading.
From a long-term trading perspective, this resistance should be seen as a make-or-break inflection point. If BTC is able to decisively break through and close above the $120,000 level on strong volume, it WOULD represent a structural shift in market behavior and likely initiate a new phase of price discovery. However, if history repeats and the trendline holds once more, the probability of a return to the $73,000 support zone increases substantially.
It’s also essential to recognize the time scale of this chart. Since this is a high time frame structure, each candle may take days or even weeks to finalize, meaning short-term moves are not sufficient to confirm a breakout or breakdown. Patience is required until full candle closures validate the next major direction.
What to expect in the coming price action
If Bitcoin fails to break the $120,000 dynamic resistance, expect consolidation or a pullback toward $73,000. A confirmed breakout above $120,000 would shift the structure entirely and require fresh analysis.
