Solana Price Primed for Rally as First Spot ETF Goes Live—Here’s Why

Solana’s moment has arrived. With its first spot ETF hitting the market, traders are betting big on a price surge—but will it deliver?
The hype is real. Spot ETFs have historically been rocket fuel for crypto assets, and Solana’s speed and low fees make it a prime candidate for institutional attention. Yet skeptics whisper: 'Another financial product begging for a bubble.'
Key factors to watch:
- Institutional inflows: Wall Street’s appetite for SOL exposure could push demand past supply.
- Network activity: A spike in transactions post-launch would validate the ETF’s timing.
One thing’s certain—the crypto casino just added a high-stakes table. Will Solana defy gravity or face the same old 'buy the rumor, sell the news' fate? Place your bets.
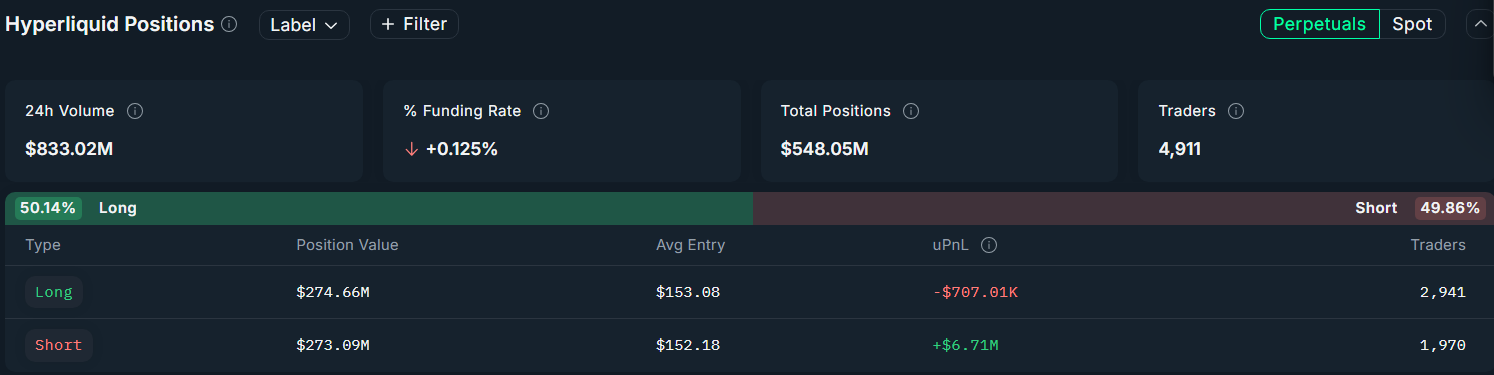 Source: Nansen
This disparity suggests that many longs bought in during the ETF HYPE and are now underwater, reinforcing a cautious near-term outlook.
Further, the market cap of stablecoins on the Solana network has fallen from $13 billion in April to around $10.5 billion as of press time, indicating a notable decline in on-chain liquidity and reduced demand for transactional activity within the ecosystem.
On top of that, despite the recent hype surrounding Solana memecoins, the network’s revenue has declined by over 90% since January.
All these factors could likely continue to weigh on Solana’s performance despite the ETF news.
Solana price analysis
On the 1-day/USDT chart, Solana (SOL) is pulling back toward the descending trendline it broke earlier, the same level that sparked today’s rally. If it falls back below this line, it could signal a trend reversal and bring back bearish momentum.
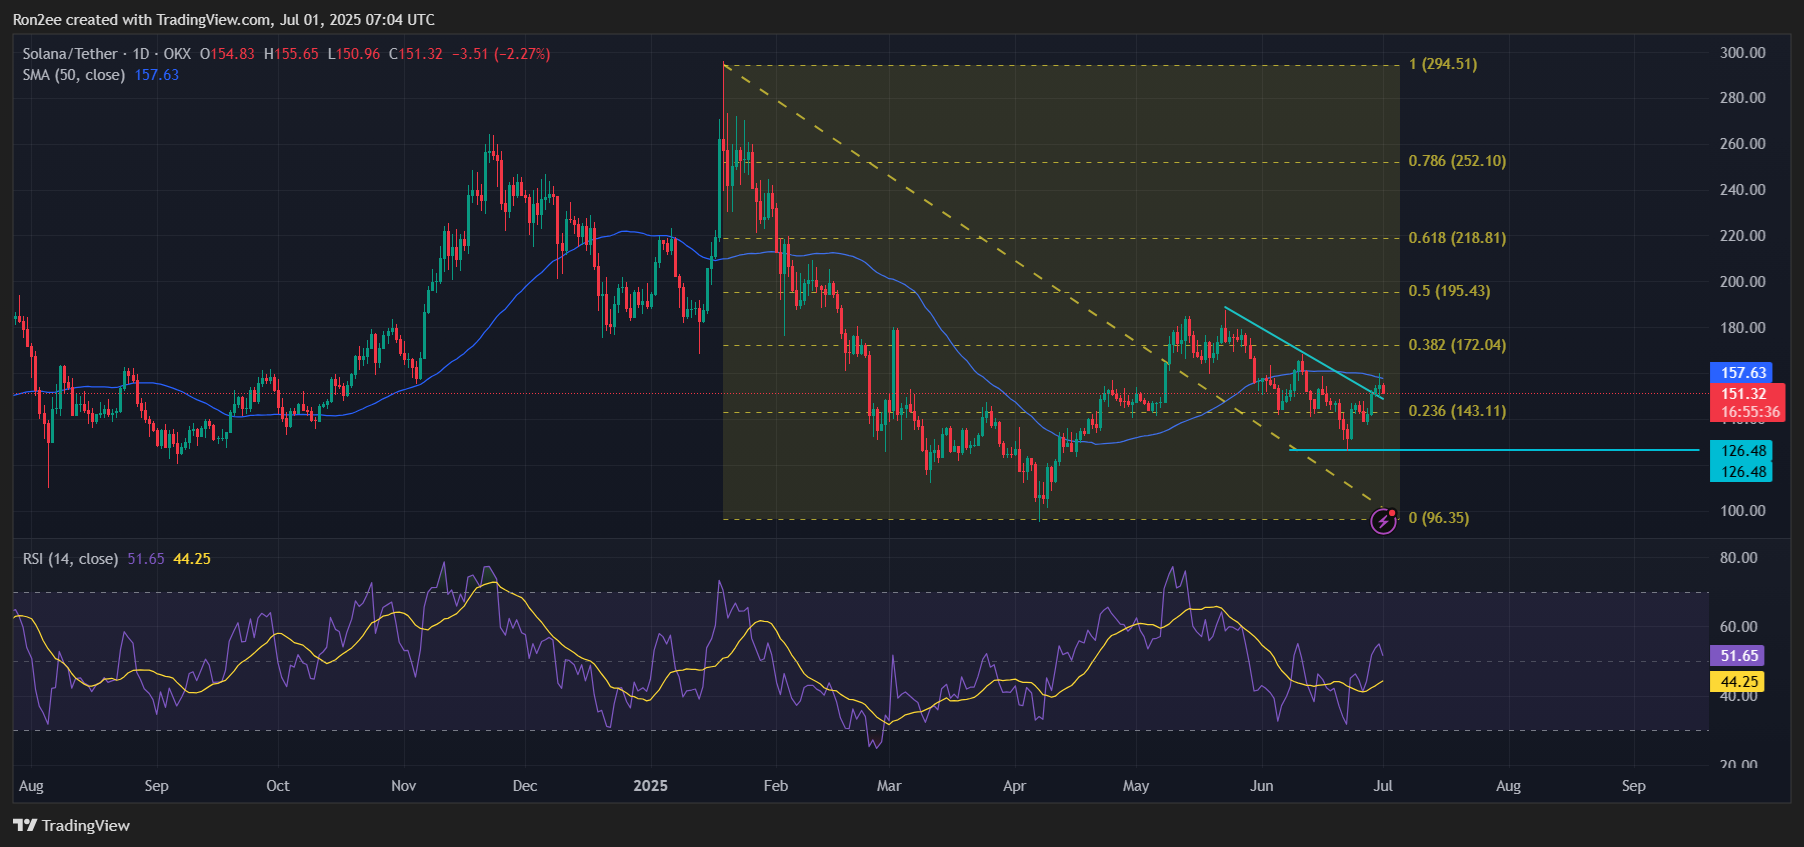
Price action has also slipped below the 50-day simple moving average, a commonly observed dynamic support level. This breakdown signals fading short-term strength and adds to the bearish technical outlook.
The Relative Strength Index, which initially ROSE to 55 after the ETF news broke, has fallen back to 51 at the time of writing, indicating that the initial buying pressure has faded.
Given these technical signals, SOL appears poised to retest support at $143.10, which aligns with the 23.6% Fibonacci retracement level. A decisive break below this level could open the path toward deeper downside, with the next key support resting at $126.48, its local low from last month.
A bearish overhang for SOL investors is that over $585 million worth of SOL will be unstaked in the next two months, which could potentially increase selling pressure and weigh further on price performance.
Still, in a market where perception often outweighs fundamentals, strong day-one flows into REX-Osprey SOL + Staking ETF could override technical weakness and drive renewed accumulation.
Disclosure: This article does not represent investment advice. The content and materials featured on this page are for educational purposes only.
