Bitcoin Open Interest Plummets for 90 Days – Prime DCA Buying Window Opens Now

Bitcoin's open interest just flashed its longest bearish streak in three months—and smart money's licking its chops.
Here's why cold wallets are heating up.
The Great Unleveraging
Futures traders bailed for 90 straight days, draining leverage from the market like a deflating balloon animal at a crypto conference after the open bar closes.
DCA's Time to Shine
With weak hands flushed out, dollar-cost averaging turns from 'boring strategy' to 'blood-in-the-streets opportunity'—assuming you believe in that whole 'digital gold' narrative Wall Street suddenly pretends to understand.
Pro tip: The suits will call this 'risk management' when they buy in at $100K after mocking your $30K entries.
Bitcoin Inches Closer To Breakout As Bulls Tighten Grip
Bitcoin bulls remain firmly in control, but a decisive breakout into price discovery is still needed to confirm the next leg of the rally. After climbing 47% since its April lows, bitcoin now trades less than 2% below its $112,000 all-time high. The market is heating up, driven by waning macroeconomic uncertainty, strong equities performance, and growing investor optimism.
However, with resistance so close, the next few days will be pivotal. A firm push above the all-time high could unlock a powerful expansion phase, while failure to break through may lead to a corrective retrace. Analysts are closely watching both technical and on-chain data to gauge the next move.
Top analyst Darkfost shared key insights into derivatives activity, highlighting the importance of tracking the 90-day change in open interest (OI). This metric gives a snapshot of how Leveraged the market is. When the 90d OI percentage flips negative, it typically signals mass liquidations or capitulation among overexposed traders, resulting in a sharp drop in open interest.
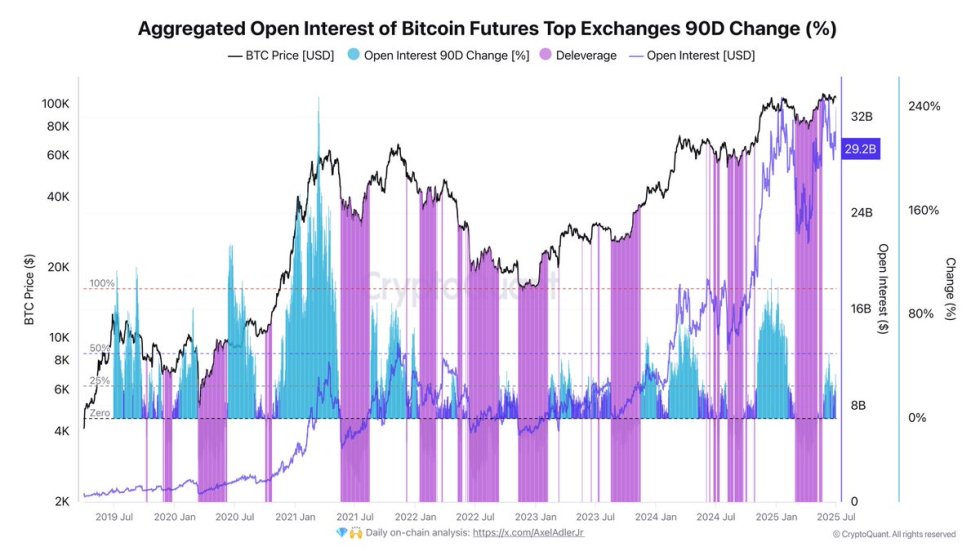
According to Darkfost, these deleveraging events—especially during bull markets—have consistently created attractive opportunities to build long positions or dollar-cost average (DCA) in the spot market. They reduce risk by flushing out weak hands and clearing excessive leverage. With current data showing a recent dip in OI followed by stabilization, many traders view this as a potential reset ahead of a breakout.
As Bitcoin consolidates near historic highs, the stage is set. Either bulls push beyond resistance and into uncharted territory, or bears gain temporary control. For now, momentum favors the upside—but confirmation remains key.
BTC Price Action Remains Range-Bound Below ATH
Bitcoin continues to trade below the key resistance at $109,300, as seen on the 4-hour chart. After failing to establish a clear breakout above this level, the price has retreated slightly to around $109,010 at the time of writing. The zone between $108K and $109.3K has become a critical area of consolidation, with both bulls and bears fighting for short-term control.
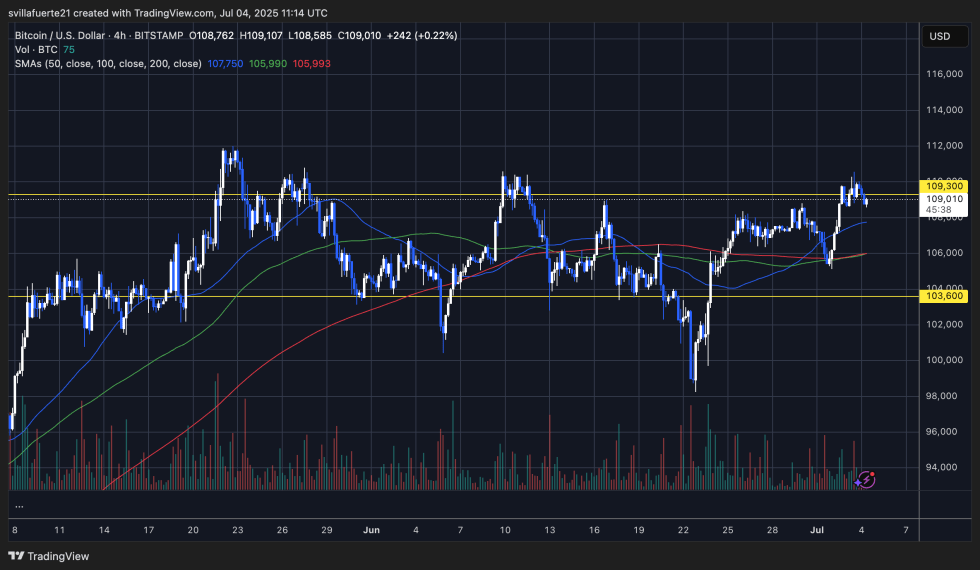
The 50, 100, and 200-period moving averages are all trending upward and converging near the $106K–$106.5K region, providing strong dynamic support. Price remains above these moving averages, suggesting a bullish structure remains intact despite the recent stalling.
Volume has decreased during the recent leg up, hinting at potential exhaustion, but not necessarily a reversal. A retest of the $109.3K resistance or a breakdown toward the $106K–$105K support zone could occur before any decisive move.
The lower support at $103,600 continues to serve as a key level that, if broken, could signal a deeper retrace. For now, Bitcoin is in a tight consolidation range, and traders are waiting for a breakout above $109.3K or a breakdown below $106K to determine the next trend direction. Until then, volatility and uncertainty are likely to persist.
Featured image from Dall-E, chart from TradingView
