Hyperliquid’s Bearish Spiral: Will $26.53 Become Reality?

Hyperliquid's price action is giving traders déjà vu—and not the good kind. After a brutal correction, the charts whisper one question: how low can it go?
Technical Breakdown: The $26.53 Threshold
Support levels are crumbling faster than a crypto influencer's credibility. If the current trend holds, Hyperliquid could test the $26.53 level—a psychological and technical tipping point.
Market Sentiment: Fear Overrides Greed
Whales are circling, retail is panicking, and your 'buy the dip' Twitter guru just went radio silent. Classic signs of a market that's forgotten its own hype cycle.
Silver Linings for Degens?
Volatility means opportunity—if you've got the stomach for it. Just remember: in crypto, 'oversold' often means 'about to get more oversold.'
Closing Thought: Another day, another 'healthy correction' that smells suspiciously like the prelude to a fire sale. But hey—at least the blockchain still works.
Key technical points
- Current Support: Value Area High region; potential for minor bounce, but unlikely to hold.
- Major Support Zone: $26.53; aligns with 0.618 Fibonacci retracement and Point of Control.
- All-Time High: $45; now acting as macro resistance after sharp reversal.
- RSI Reading: Below 50 and not yet oversold; further downside likely before recovery.
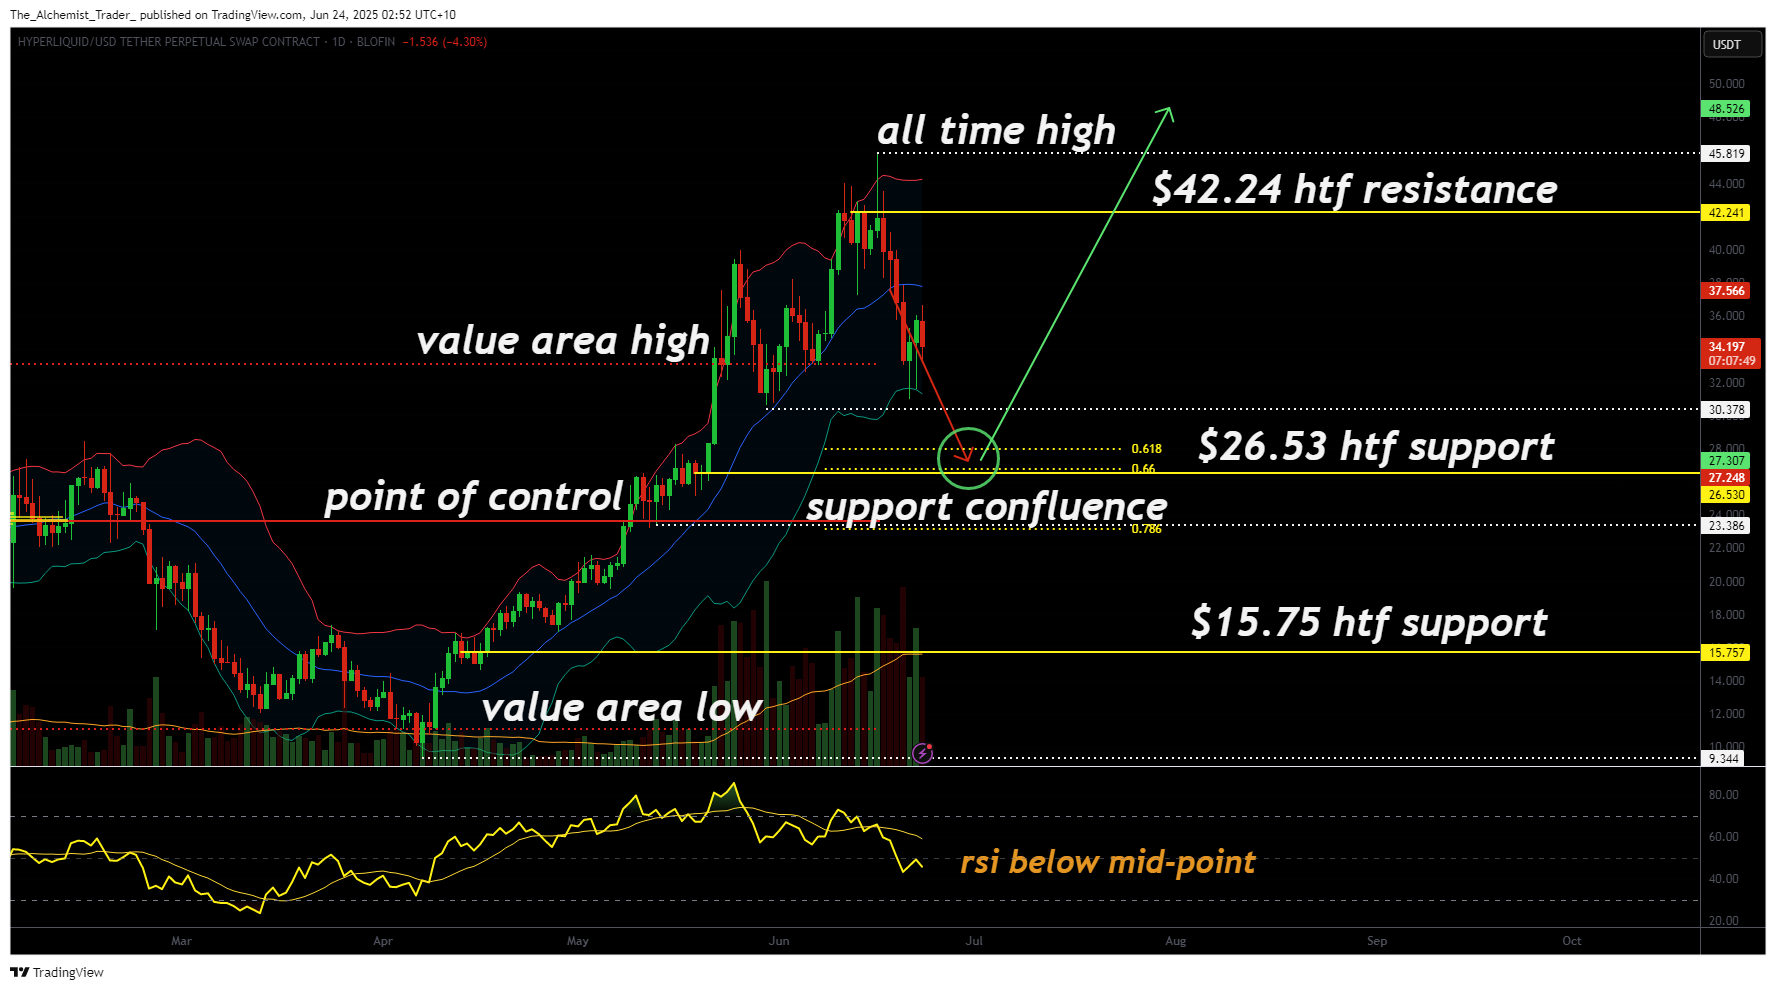
The recent downtrend began after Hyperliquid set a new all-time high just under the $45 mark. Since that peak, price has continued trending downward, with no confirmed higher low or trend reversal. The current region being tested, the Value Area High, is not a major support zone, suggesting that any bounce here is likely to be short-lived and more corrective than bullish.
The technical picture implies that the market is still in search of a meaningful support base. The next critical level lies at $26.53, which is supported by strong technical confluence: the 0.618 Fibonacci retracement from the previous major leg up, as well as the Point of Control, an area of highest volume traded. This makes $26.53 the most significant level to watch for a potential bottom.
The RSI is also playing an important role in this structure. Currently below the 50 midline, it signals bearish momentum and suggests that further downside is likely until oversold conditions are officially reached. A drop into that oversold region WOULD coincide well with a test of the $26.53 support and would offer the technical foundation for a meaningful higher low to form.
Until such a confluence occurs, price action is likely to remain weak and subject to further correction. Traders should remain cautious in assuming a bottom is in without confirmation from volume, structure, and indicator signals.
What to expect in the coming price action
Hyperliquid is still in corrective mode and has yet to confirm a higher low. Until the $26.53 support zone is tested and oversold RSI conditions are met, downside risk remains in play. This level could mark the foundation for a new bullish leg, but it hasn’t arrived yet.
