Shiba Inu Plummets—But a Stealth Bullish Pattern Emerges

Shiba Inu’s price tanks—again. But don’t look away just yet. Beneath the bloodshed, a classic bullish setup is forming. Could this be the calm before the meme coin storm?
The dog-themed token’s latest nosedive has traders groaning. Yet chartists whisper about an ascending triangle brewing on the weekly. You know, that pattern where everyone pretends to understand Fibonacci levels.
If the pattern holds, SHIB could break north hard. If not? Well, at least the ‘buy the dip’ crowd will have fresh ammo. Because nothing fuels crypto like hopium and hindsight.
Funny how these ‘technical formations’ always look perfect… after the fact. Maybe that’s why Wall Street still laughs at our crayon-drawn support lines. But hey—this time it’s different, right?
Shiba Inu price is forming a bullish pattern
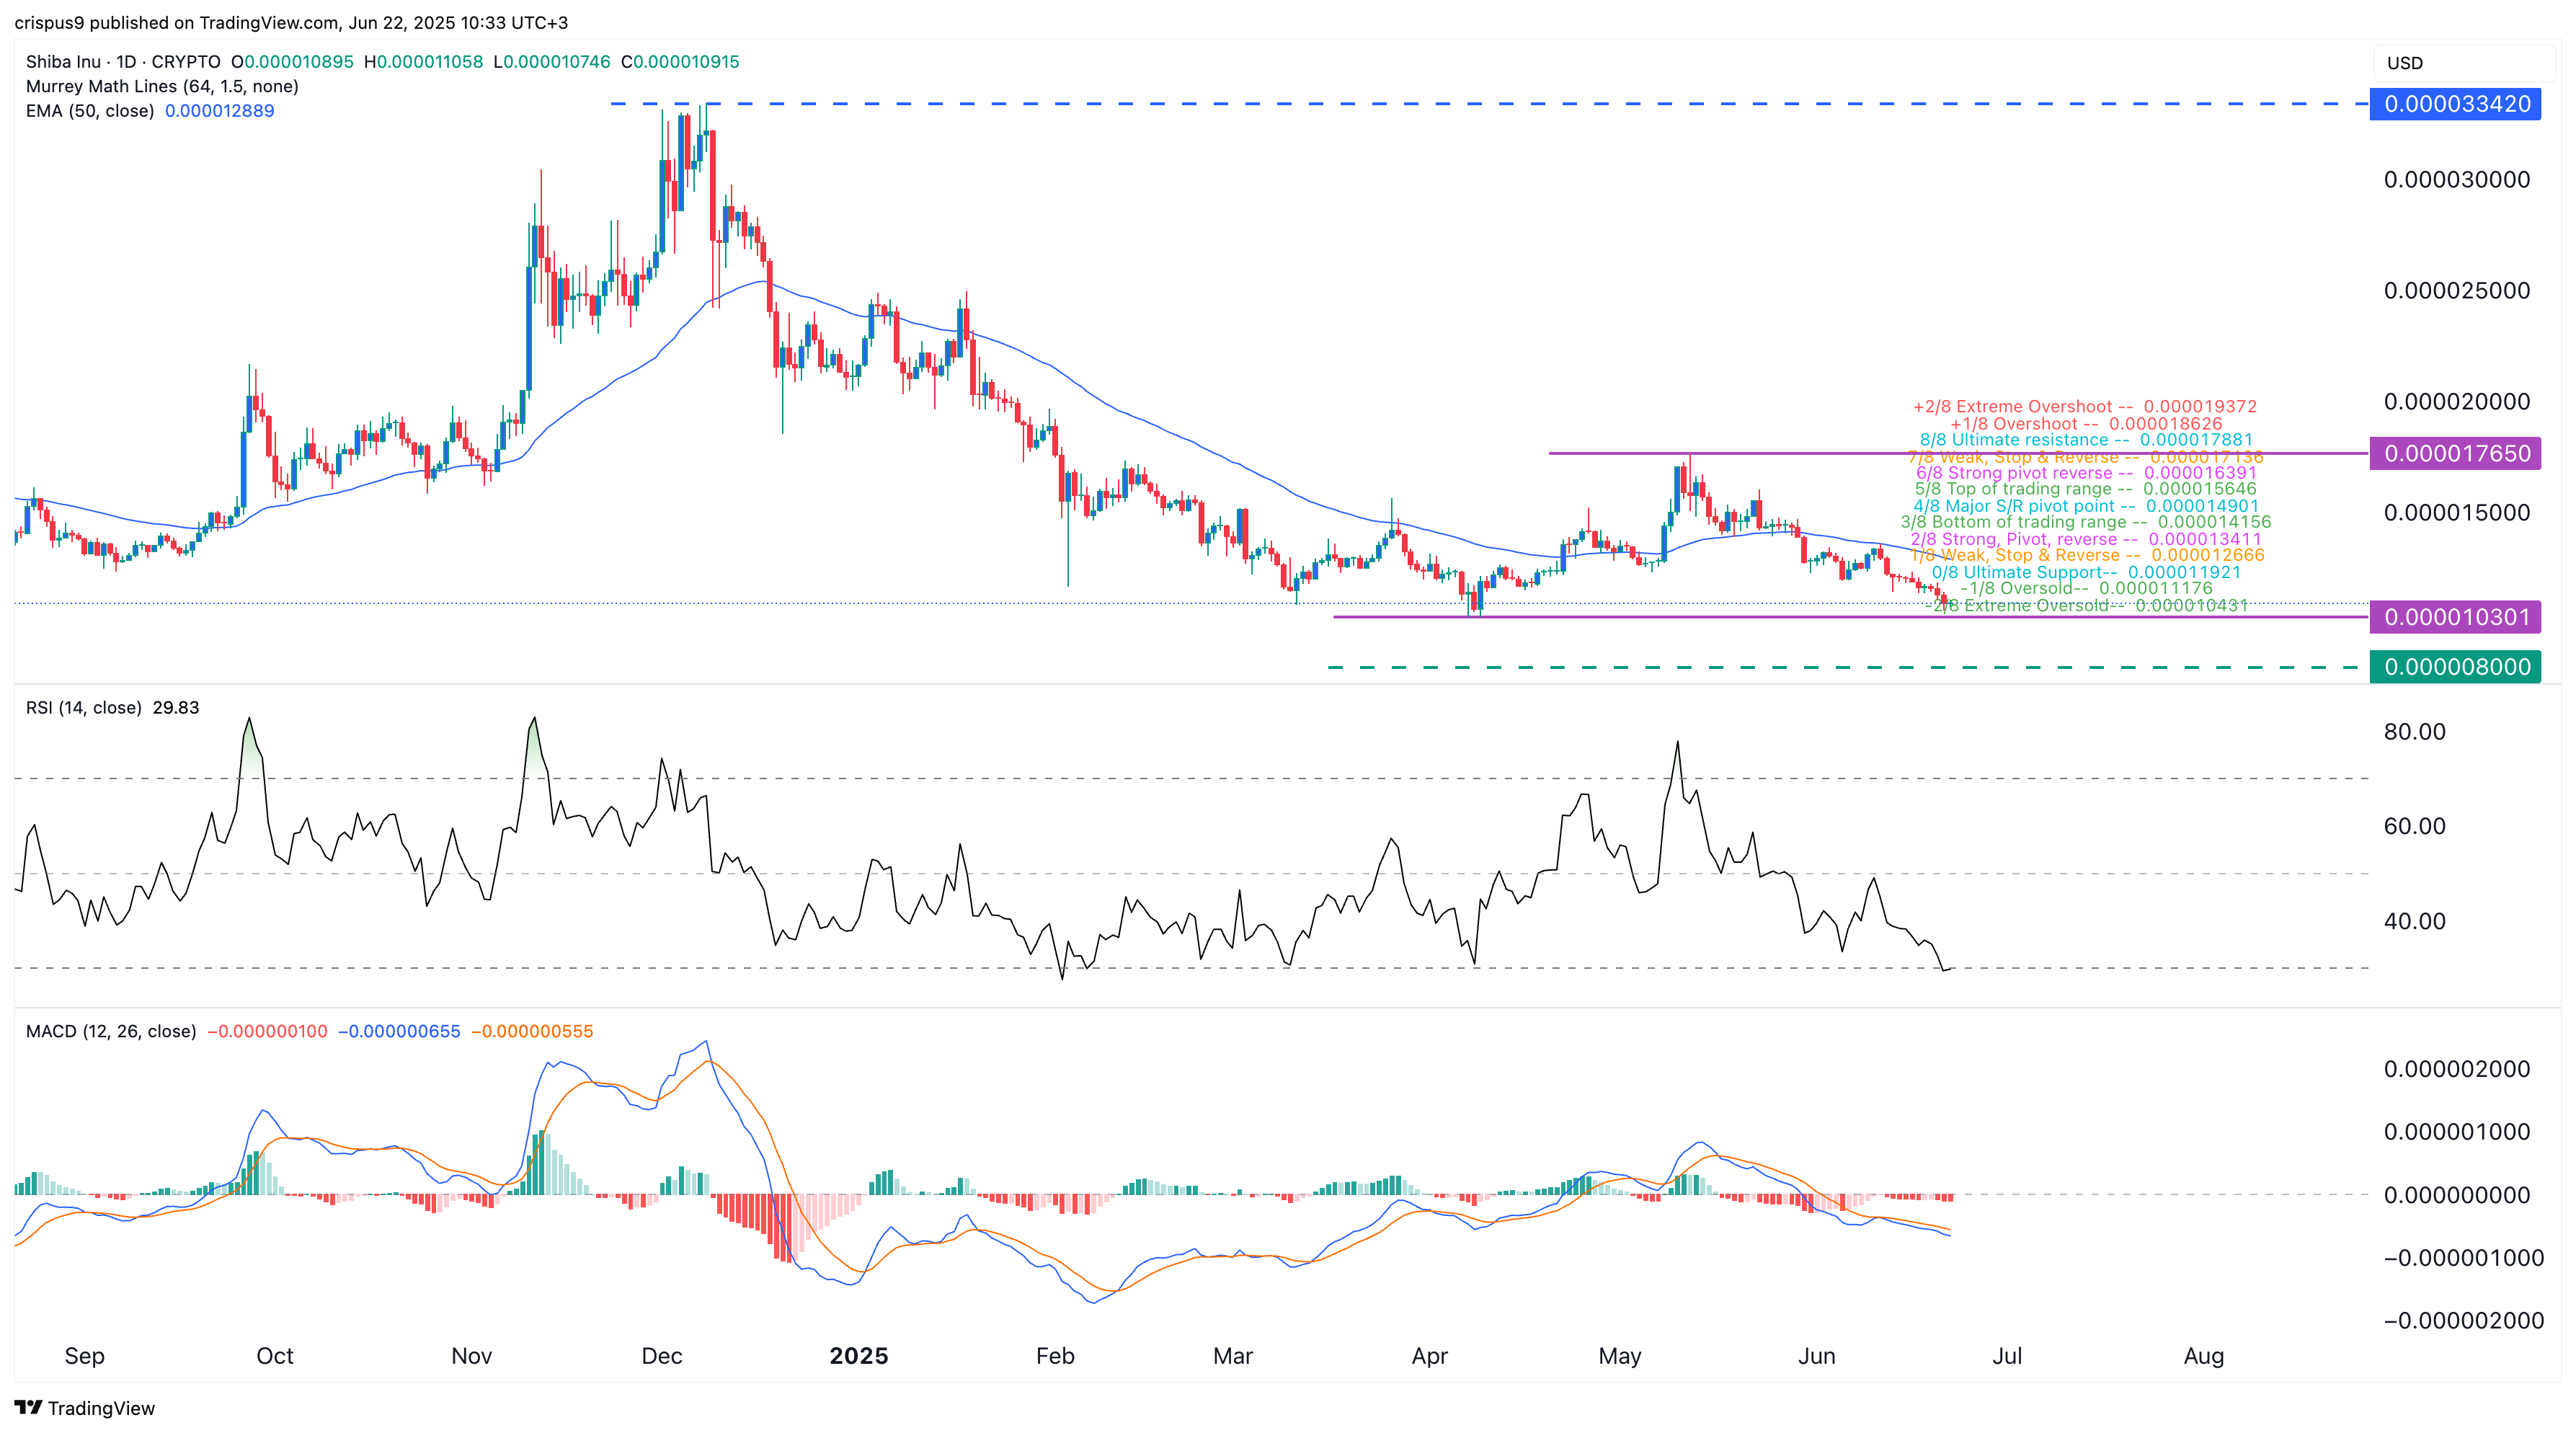
The daily chart shows that the SHIB price has plunged from $0.00001765 in May to $0.000011 today. It has moved below all moving averages, indicating that bears remain in control.
The shiba inu price has moved to the extreme oversold level of the Murrey Math Lines tool. Similarly, the Relative Strength Index has moved to the oversold level of 30. Other oscillators, like the Stochastic Oscillator and the MACD, have also pointed downwards, a sign that the downtrend may continue.
On the positive side, SHIB price is slowly forming a double-bottom pattern at $0.00001030. A double-bottom happens when an asset forms two distinct support levels and a neckline at $0.00001765.
Therefore, Shiba Inu’s outlook is bullish as long as it remains above the double-bottom point at $0.00001030. If this works, the token will likely rebound to the neckline, about 62% above the current level.
A drop below the support at $0.00001030 will invalidate the bullish shiba inu forecast and point to more downside, potentially to the psychological point at $0.0000080.
