Robinhood vs. Coinbase: Which Crypto Broker Stock Will Outperform in 2025?
Two titans clash as retail investors scramble for exposure—will the zero-commission pioneer or the crypto pure-play win the race?
The case for Robinhood: Millions of millennial users, a sticky ecosystem, and that addictive confetti animation. But can it shake off the meme-stock baggage?
The Coinbase angle: Regulatory battles? Bring 'em on. This exchange thrives on volatility—when crypto sneezes, COIN stock catches a cold (or rockets 50%).
Wall Street analysts remain divided—just like their price targets. Meanwhile, both companies quietly profit whether you're buying or panicking. Classic.
Key technical points
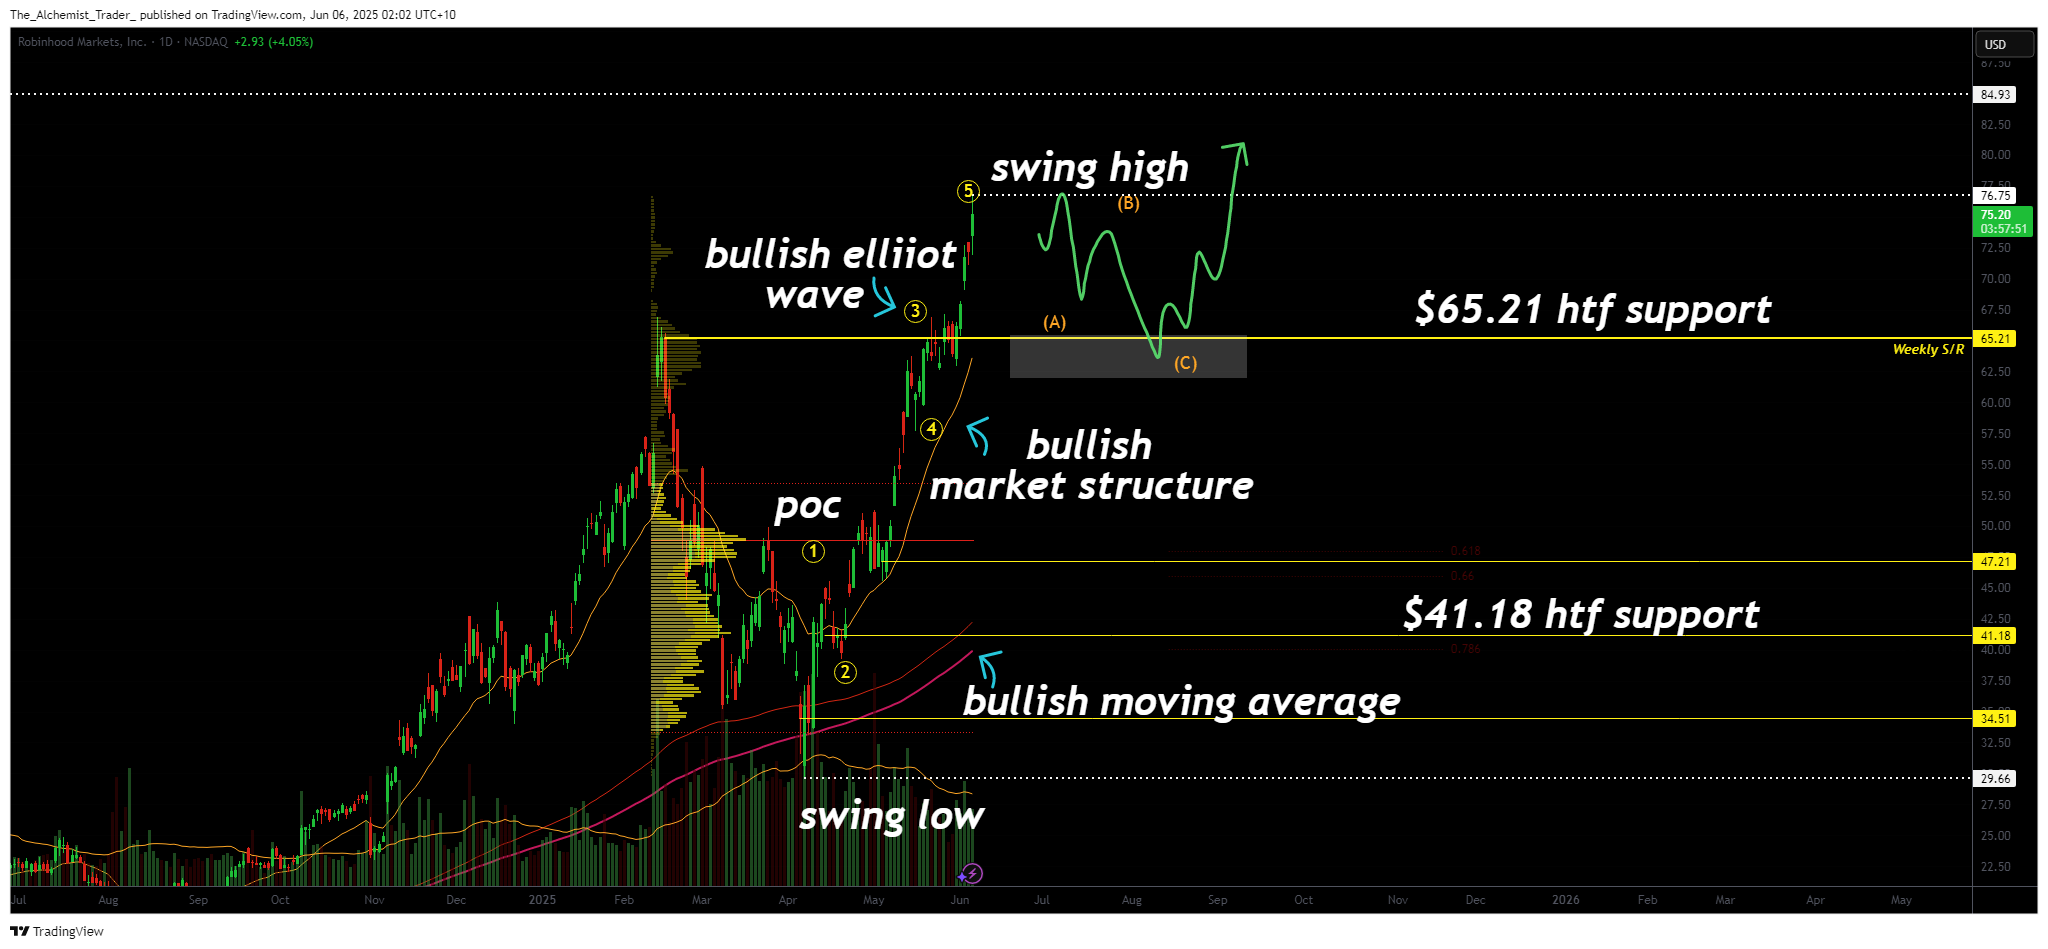
- Robinhood Elliott Wave Count in Progress: Robinhood is currently in Wave 5 of a bullish Elliott Wave pattern, signaling potential for further continuation after a brief corrective phase.
- Robinhood Key Support at $65.21: Price needs to hold above this weekly SR level for continuation higher. This level will determine whether the bullish trend resumes.
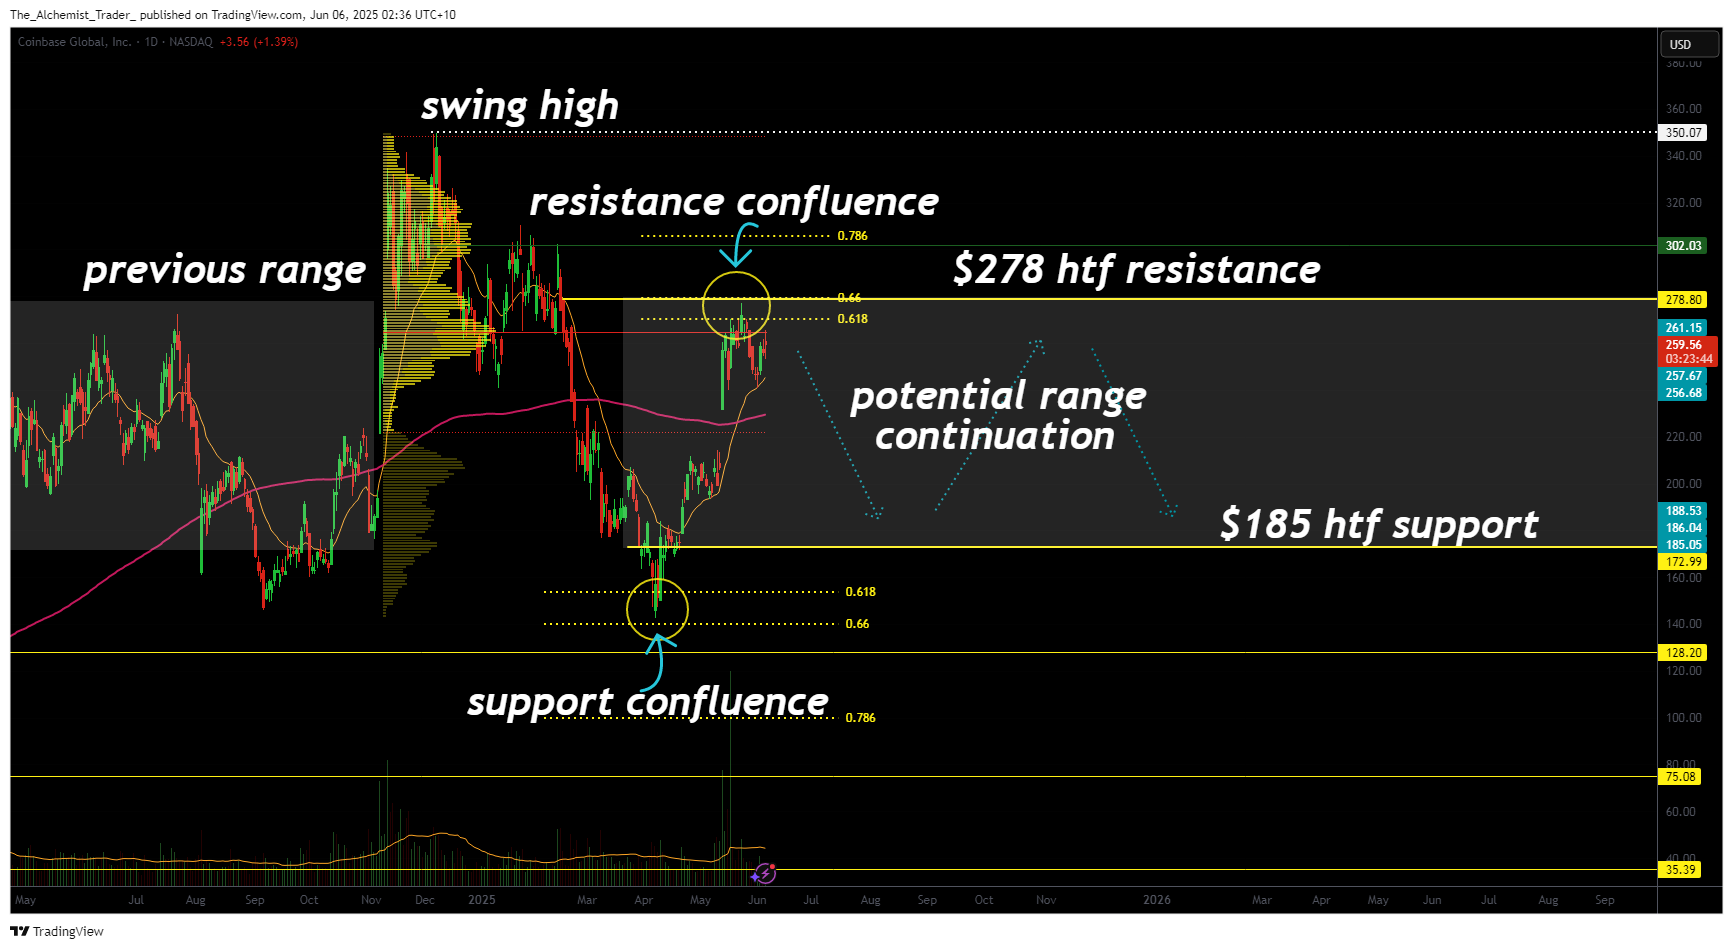
- Coinbase Range Bound Between $185 and $278: COIN remains trapped in a long-term horizontal channel, with no sign of breakout or sustained momentum beyond key boundaries.

Price action on Robinhood shows a clear bullish advance. After forming a swing low at $29, the stock entered a strong rally that fits the framework of an Elliott Wave pattern, one of the most common bullish continuation formations. The current structure suggests a completed or nearly completed 1-2-3-4-5 count, placing price action within or near the terminal stage of Wave 5.
The completion of Wave 5 typically signals a corrective phase, commonly an ABC retracement, before continuation. A short-term pullback is therefore not only possible but expected. In this context, the $65.21 level, a high-timeframe support previously broken and reclaimed, is the critical zone to watch. If this level holds during a pullback, it WOULD provide the technical setup for a bullish re-accumulation and continuation higher.
Structurally, Robinhood continues to print higher highs and higher lows, affirming bullish momentum. The recent move to $76 marks a new local high, a breakout that is not being mirrored in Coinbase’s chart.

In contrast, Coinbase remains stuck in a wide horizontal range, trading between $185 support and $278 resistance. This range has dictated the stock’s behavior for several months, with repeated rejections at resistance and failures to hold breakouts, classic range-bound behavior.
These conditions usually require a decisive breakout above resistance or a breakdown below support to establish a new trend. Until then, price is likely to continue oscillating between boundaries, offering little clarity for medium-term trend traders.
Despite positive macro conditions and crypto strength, COIN has yet to show breakout confirmation. The absence of higher highs or directional volume reinforces a neutral-to-bearish technical profile in the short term.

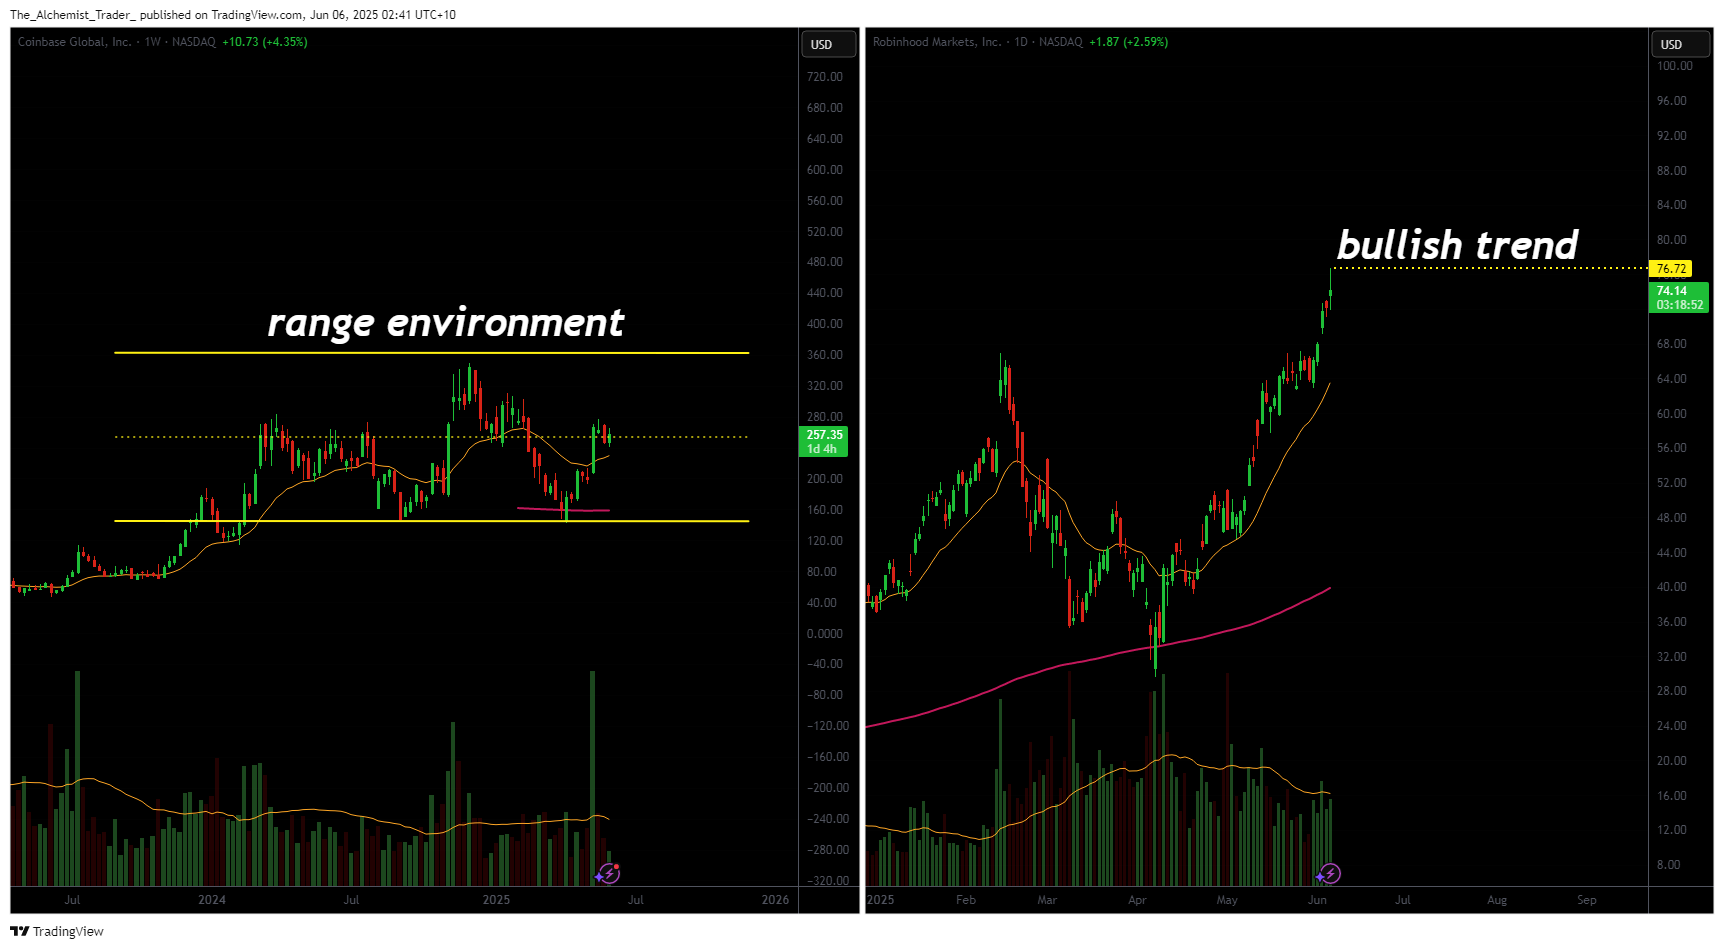
Putting the two charts side by side, the difference in structure becomes immediately evident. Robinhood is in a trending environment, supported by bullish volume profiles, Elliott Wave structure, and breakout price action. Coinbase is still trapped in a consolidative phase, with no confirmed breakout or bullish continuation signal.
Momentum indicators like RSI also favor Robinhood, which remains comfortably above its 200-day moving average. Volume behavior reinforces this: Robinhood shows expansion during rallies and healthy consolidation between moves, signs absent from Coinbase’s sideways drift.
Furthermore, the confluence at Robinhood’s $65 zone adds technical conviction to the bullish case. A successful retest of this level would offer a low-risk long setup targeting a retest of $76 and potentially new highs.
What to expect in the coming price action
In the immediate short term, Robinhood appears to be the stronger technical hold. The bullish Elliott Wave structure, new high formation, and key support below all point to a continuation of the uptrend — assuming a successful retest of $65.21.
Coinbase, on the other hand, is still in a trading range with no technical breakout confirmed. Until price either clears $278 or breaks below $185, the asset is more likely to continue oscillating within the range — offering less upside potential and more uncertainty for short-term holders.
For investors looking for exposure to a trending crypto-related stock, Robinhood is currently the better-positioned asset. A successful pullback and hold above support could mark the beginning of a new bullish leg, whereas Coinbase still needs to prove it can break its high timeframe range.

