ZORA teeters on 15% plunge as technicals flash red

Another day, another crypto chart doing its best impression of a rollercoaster—this time it's ZORA's turn. The token's technical setup screams 'sell' louder than a trader watching their leverage get liquidated.
When the lines on the screen align this ominously, even the most diamond-handed hodlers start sweating. That 15% drop prediction? It's not FUD—it's just math catching up with hype.
Funny how these 'bearish signals' always appear right after the whales finish dumping their bags. Crypto markets: where the technicals are made up and the fundamentals don't matter.
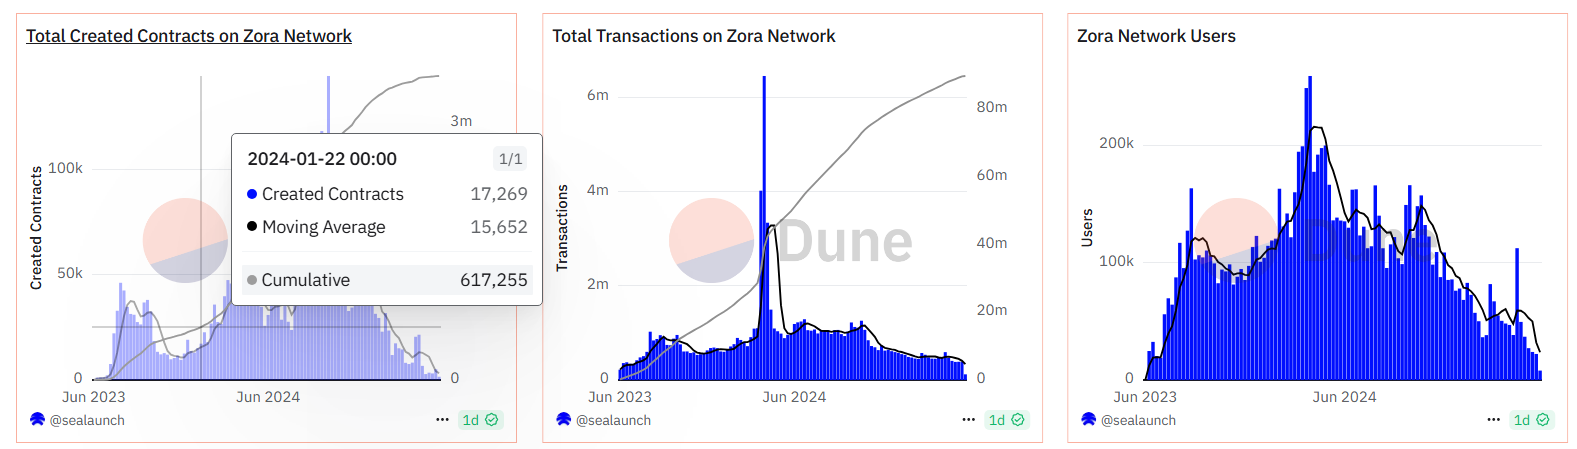 Source: Dune Analytics
Likewise, the number of transactions has fallen from an all-time high of 6.45 million to just 121,000, while active users have slid from nearly 259,000 to around 8,000.
These figures indicate that, despite renewed HYPE from artist collaborations, overall user engagement and developer activity on the Zora network continue to weaken.
ZORA price analysis
On the 4-hour chart, ZORA recently broke out above a descending trendline that had been capping price action since May 26, which helped trigger the latest price bounce.
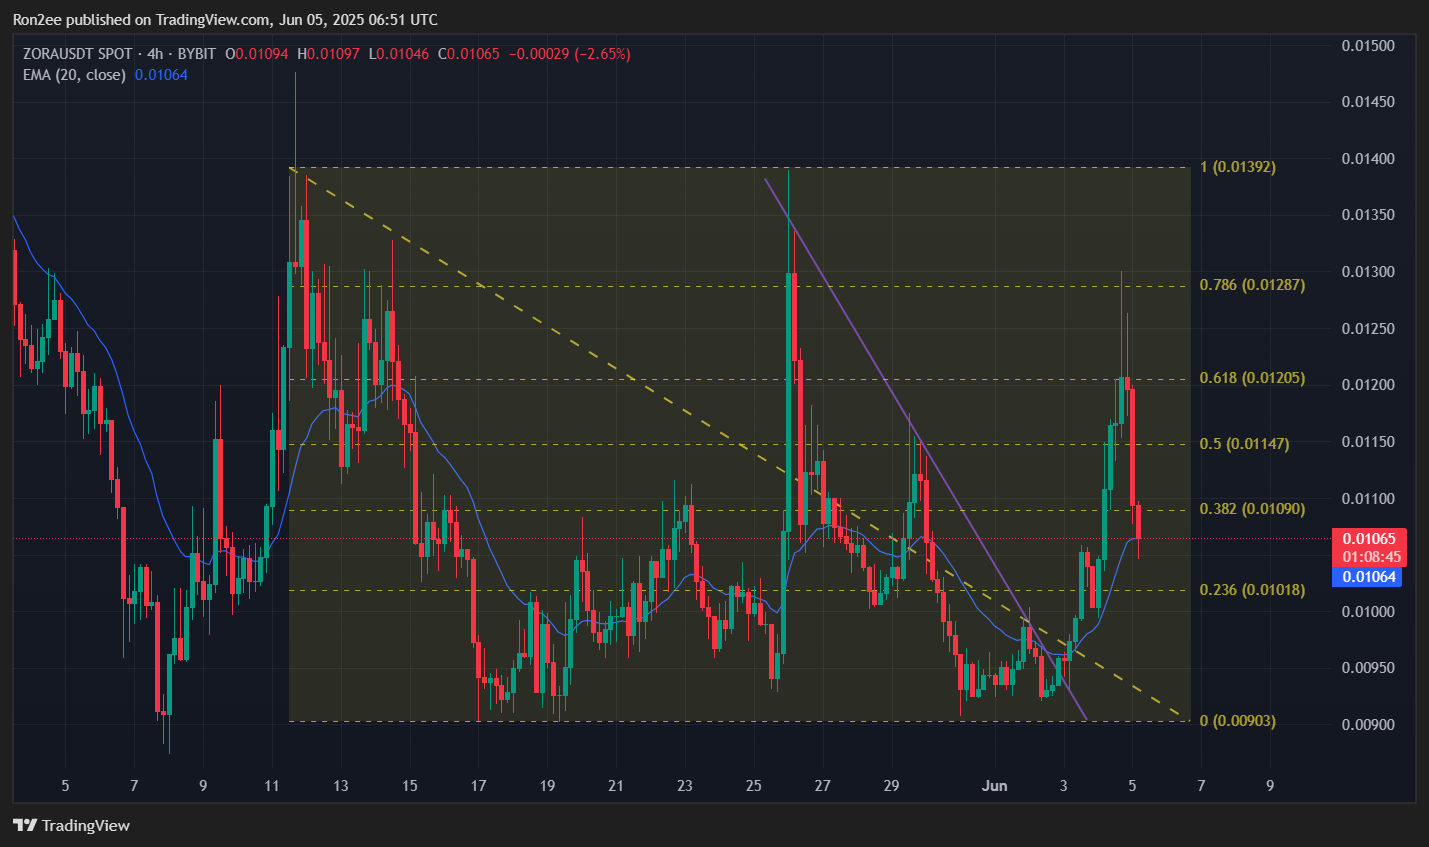
However, zooming out reveals a more concerning setup. ZORA has formed a double-top pattern NEAR the $0.013 level, with peaks on May 11 and May 26. This is typically seen as a bearish reversal signal, especially when followed by weakening momentum.
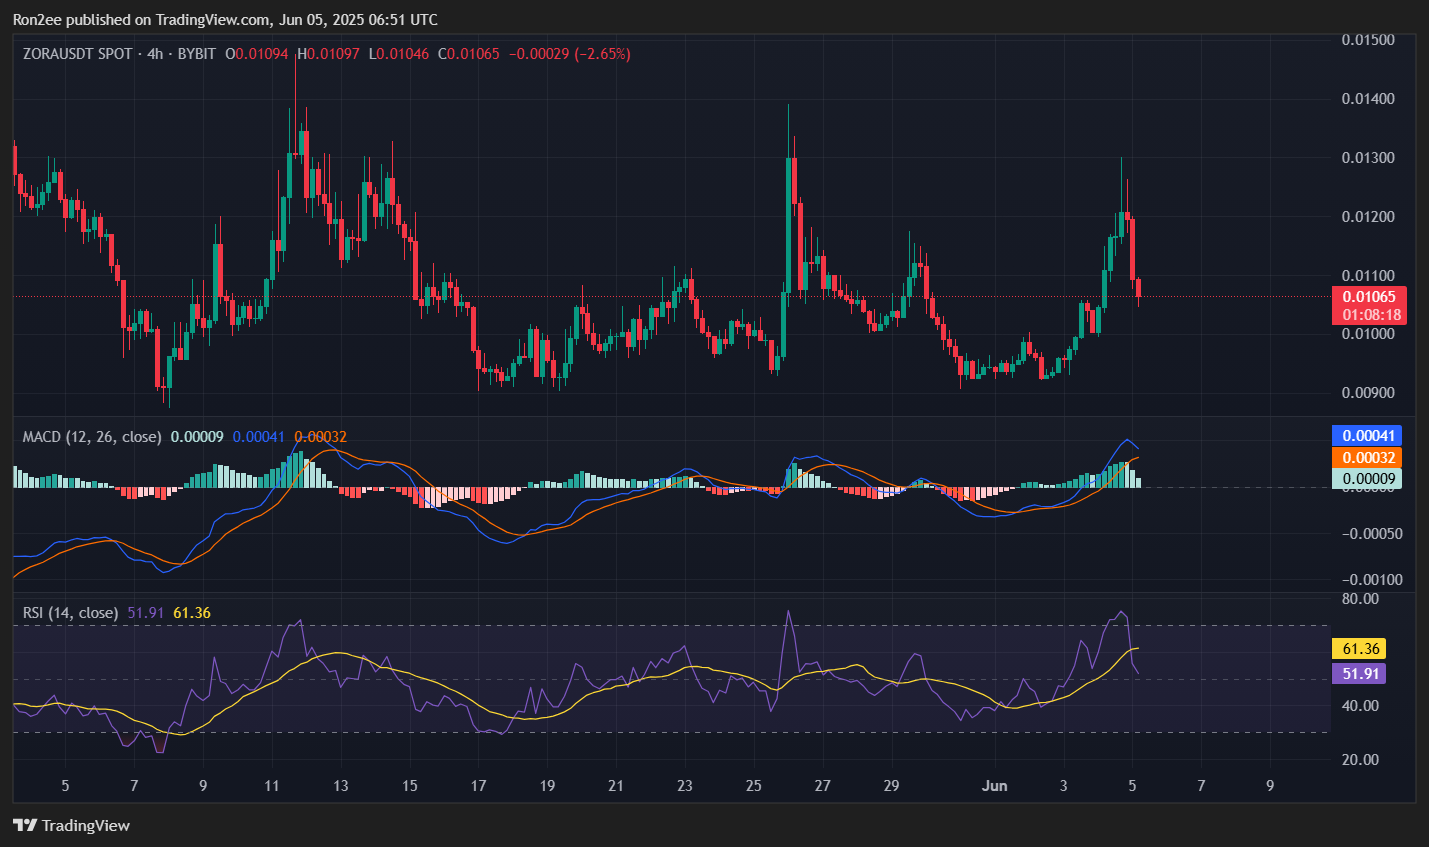
The token is also close to dipping below its 20-day Exponential Moving Average, and the MACD indicator looks close to flipping bearish with a potential crossover below the signal line. Additionally, the Relative Strength Index is trending downward, suggesting fading buying pressure.
Given the weakening fundamentals and bearish technical indicators, there is a strong likelihood that ZORA could be on track to retest the $0.0090 support zone, which has held up as a reliable floor since the token’s launch. That WOULD mark a roughly 15% drop from current levels.
On the flip side, if bulls manage to reclaim the $0.012 resistance, which also lines up with the 61.8% Fibonacci retracement level, it would invalidate the bearish outlook and potentially open the door for another leg up.
Disclosure: This article does not represent investment advice. The content and materials featured on this page are for educational purposes only.
