Sui’s Bullish Flag Hints at Imminent All-Time High—Traders Brace for Liftoff

Sui’s price chart flashes a textbook bullish flag—a formation that historically precedes explosive rallies. Market veterans are eyeing a potential breakout that could catapult the asset past previous records.
Technical indicators suggest accumulation is underway, though skeptics warn the pattern could break downward if Bitcoin decides to crash the party—as it so often does in this copycat market.
Either way, leverage traders are already positioning themselves for volatility. Because when has excessive risk ever backfired in crypto?
Sui price technical analysis
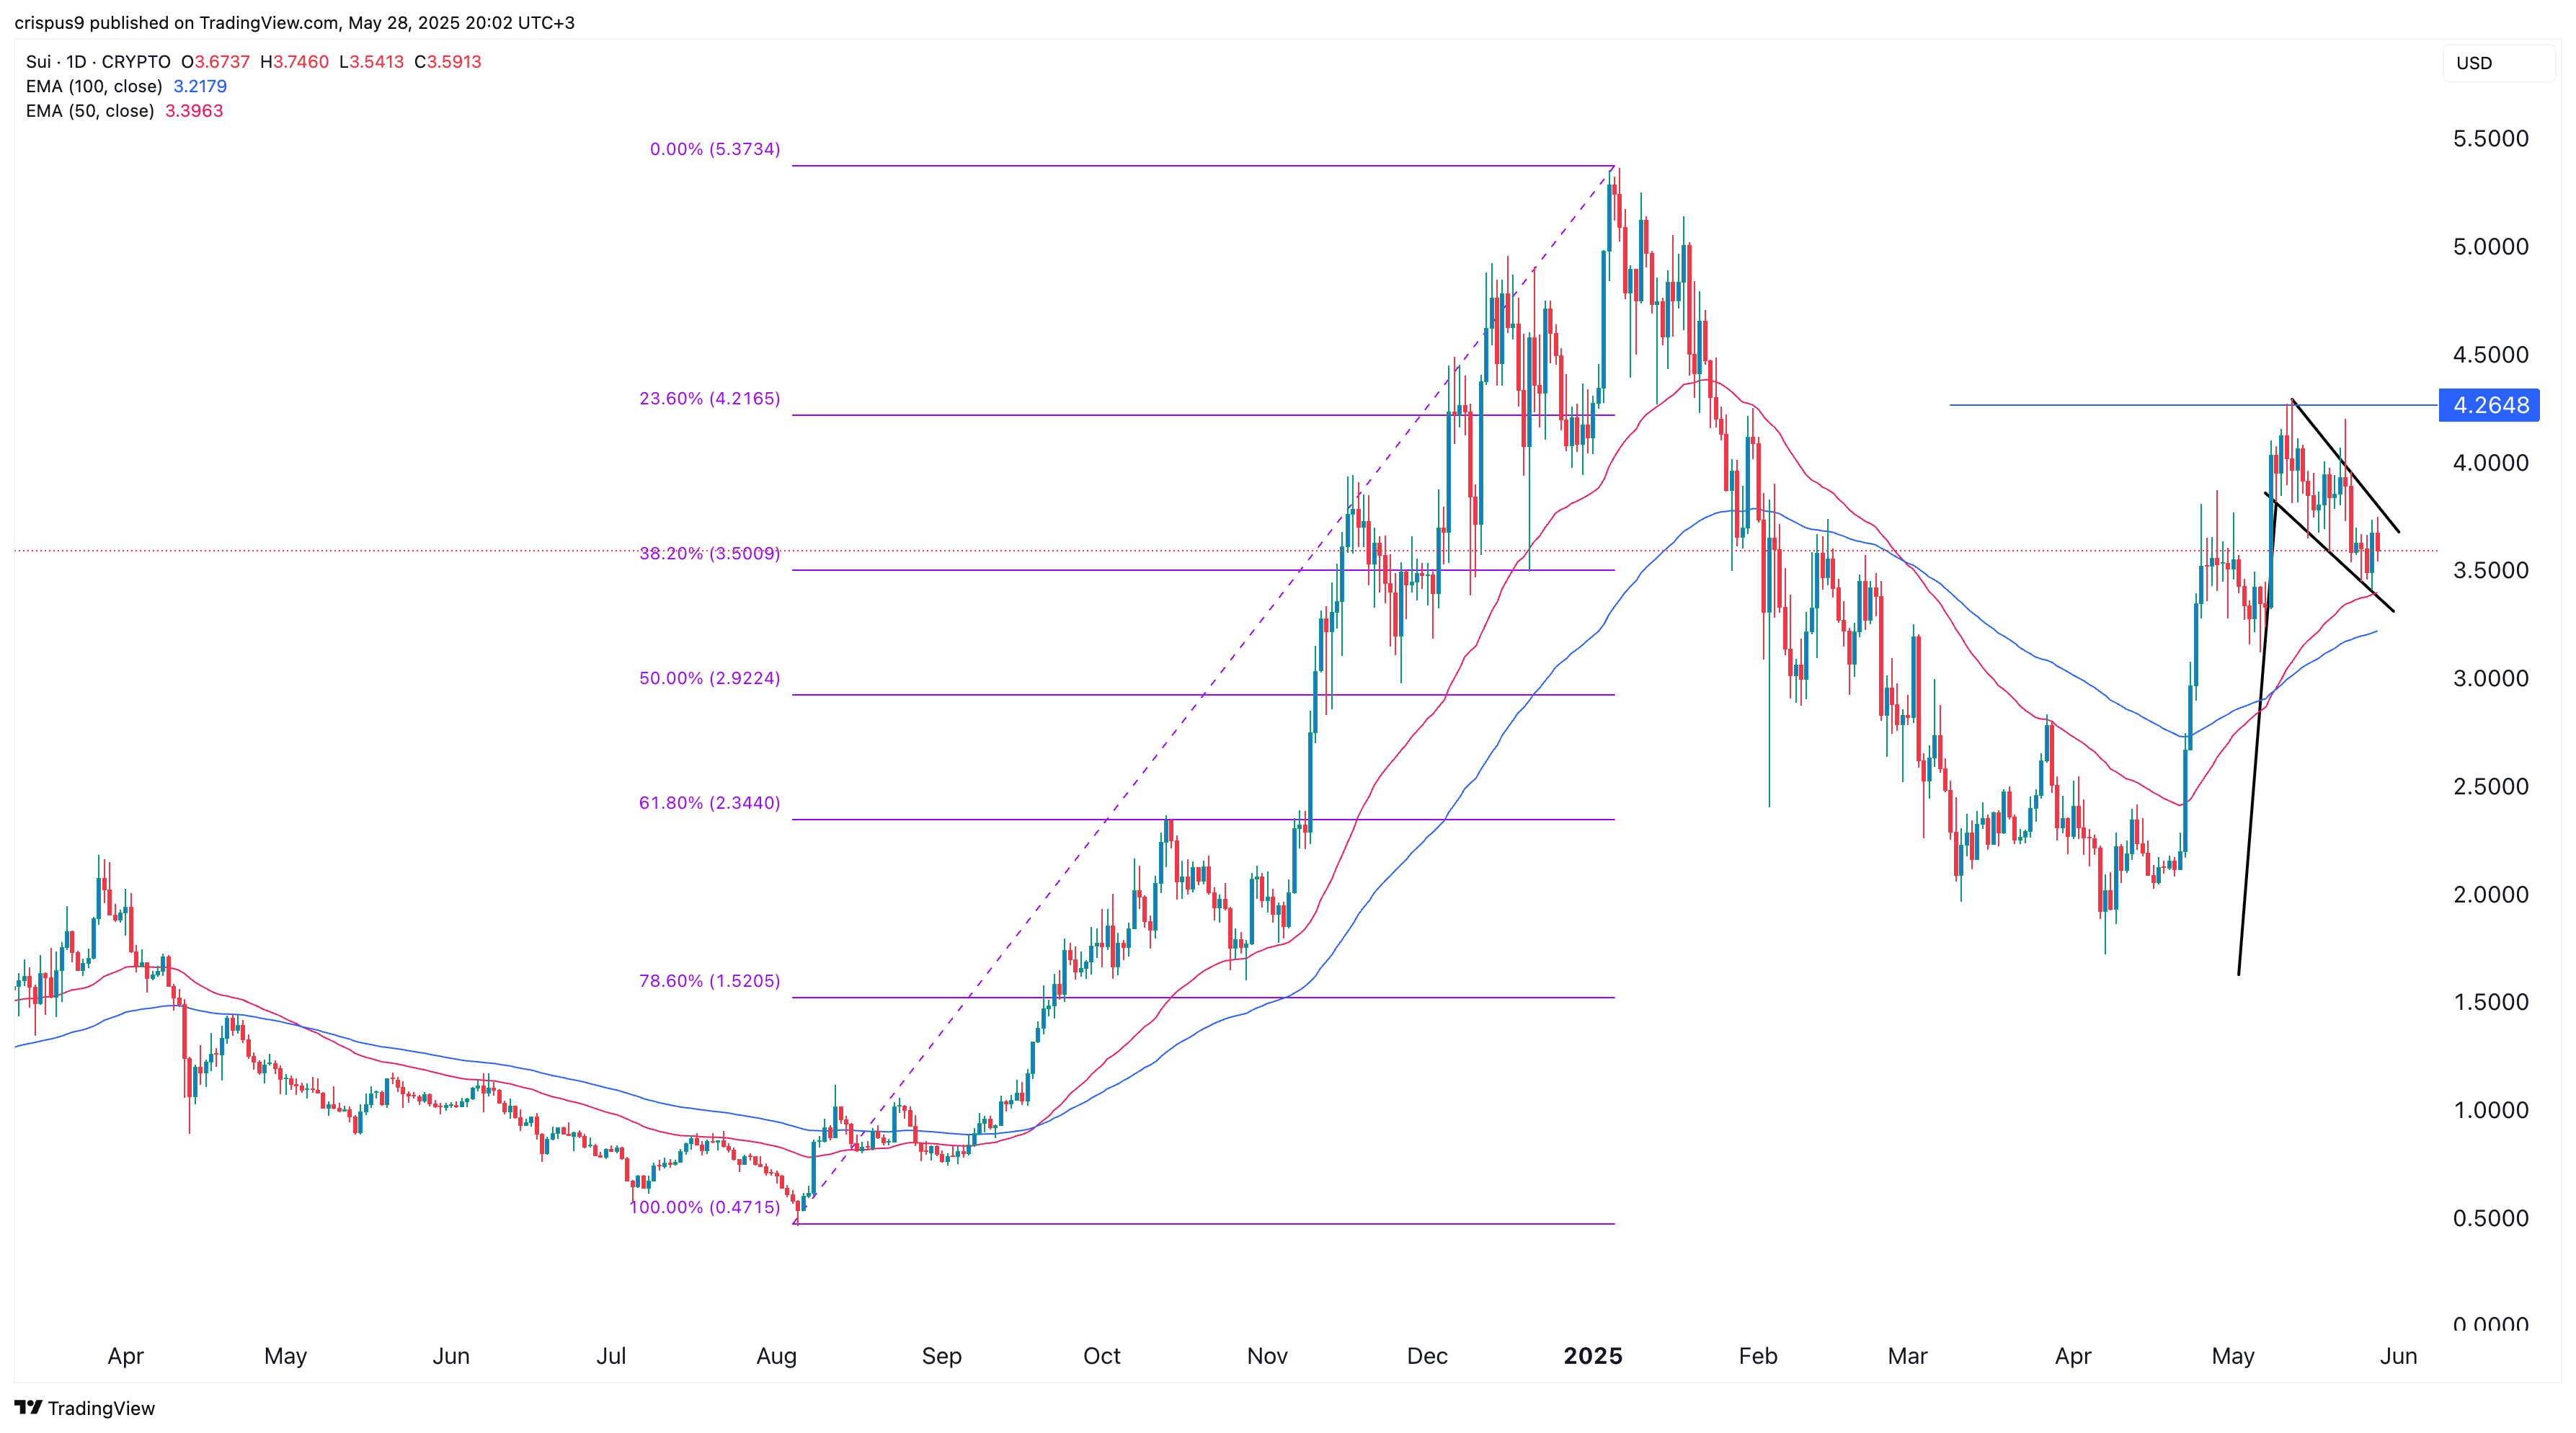
The daily chart shows that Sui has formed a descending channel following last week’s Cetus hack. This channel appears to be the flag portion of a bullish flag chart pattern, a classic continuation signal.
Price has remained above the 50-day and 100-day exponential moving averages, indicating that bulls still have control. It has also retested the 38.2% Fibonacci retracement level, another positive technical sign.
Given these conditions, SUI is likely to bounce, with an initial target at $4.2648, the monthly high and 23.6% retracement level. A breakout above that level would signal further upside, potentially driving the price toward the all-time high of $5.3735, representing a 50% gain from current levels.

Log in to Reply
Log in to comment your thoughtsComments
Related Articles
|Square
Get the BTCC app to start your crypto journey
Get started today Scan to join our 100M+ users