AAVE Primed for 50% Rally as Rare Bull Signal Flashes

DeFi’s sleeping giant wakes up—technical charts hint at explosive upside for AAVE.
Pattern recognition bots (and a few over-caffeinated traders) spot a textbook bullish formation brewing. When these setups trigger, they tend to deliver—no promises, but the algorithm says ’buy’.
Just don’t mention that most ’rare patterns’ get rug-pulled faster than a VC’s exit strategy.
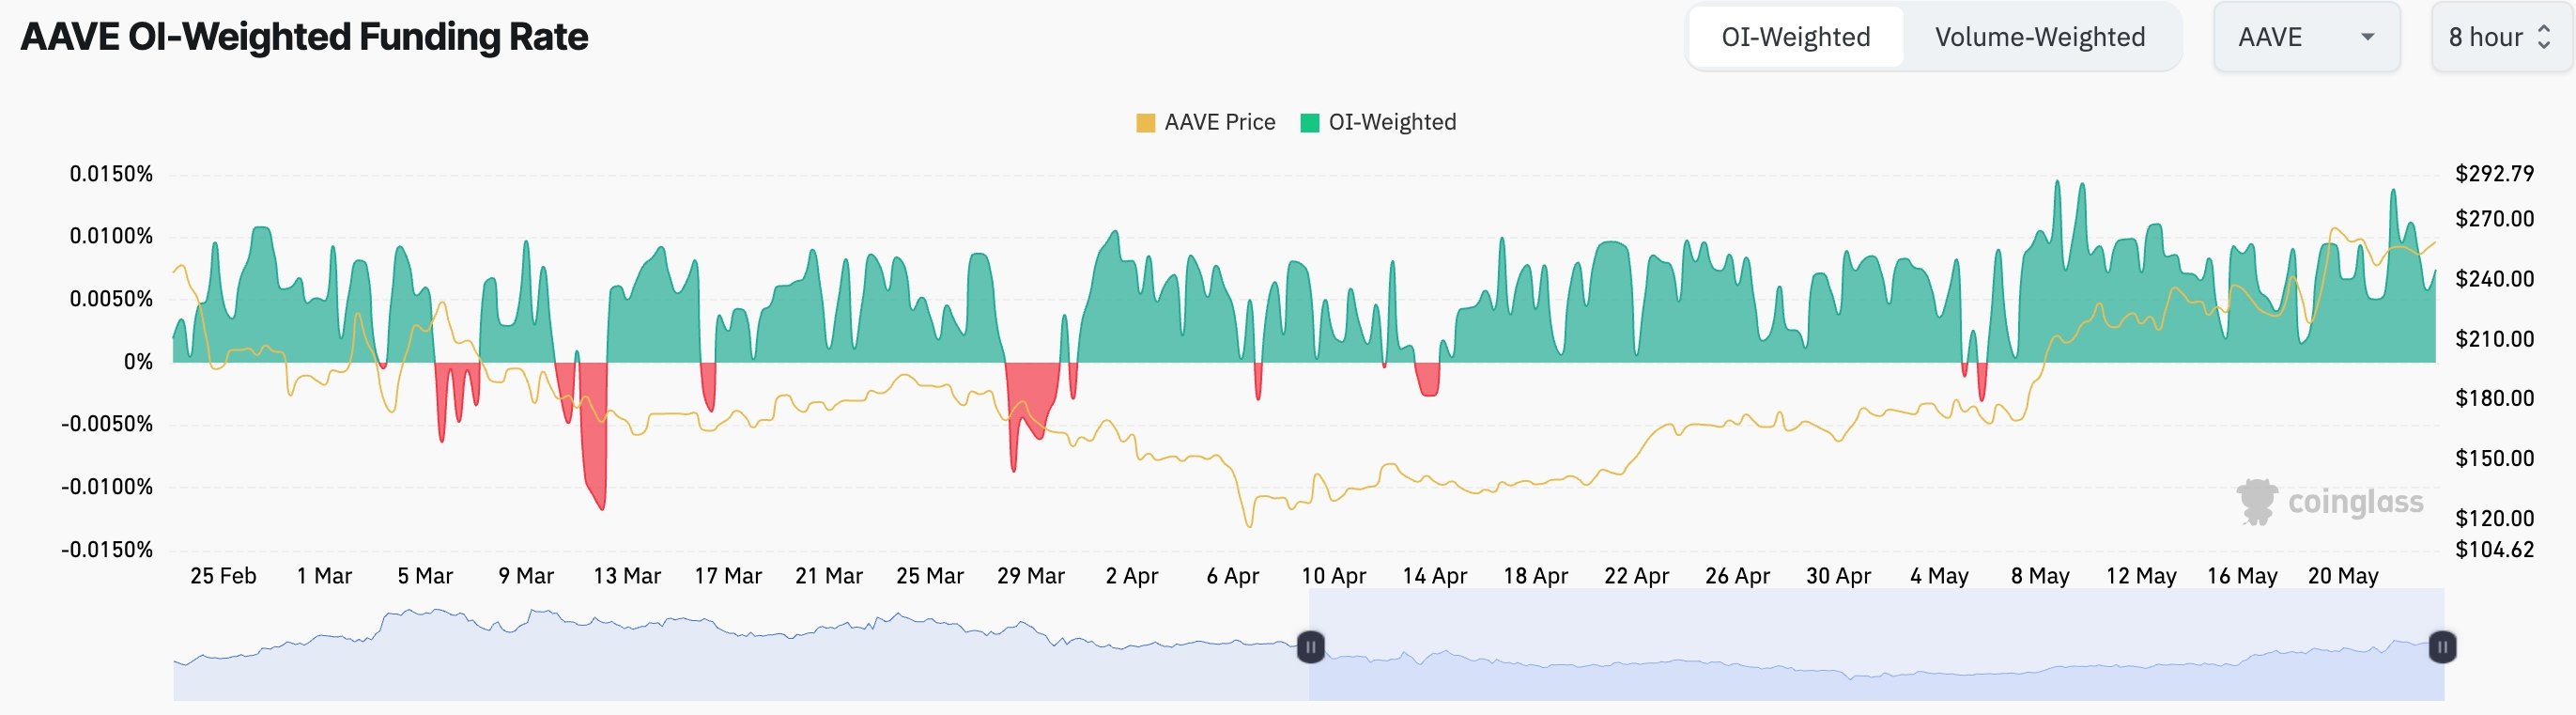 AAVE funding rate chart | Source: CoinGlass
Its balances on exchanges have continued falling. CoinGlass data shows that 2.16 million coins are on exchanges, down from the year-to-date high of 2.72 million.
AAVE price technical analysis
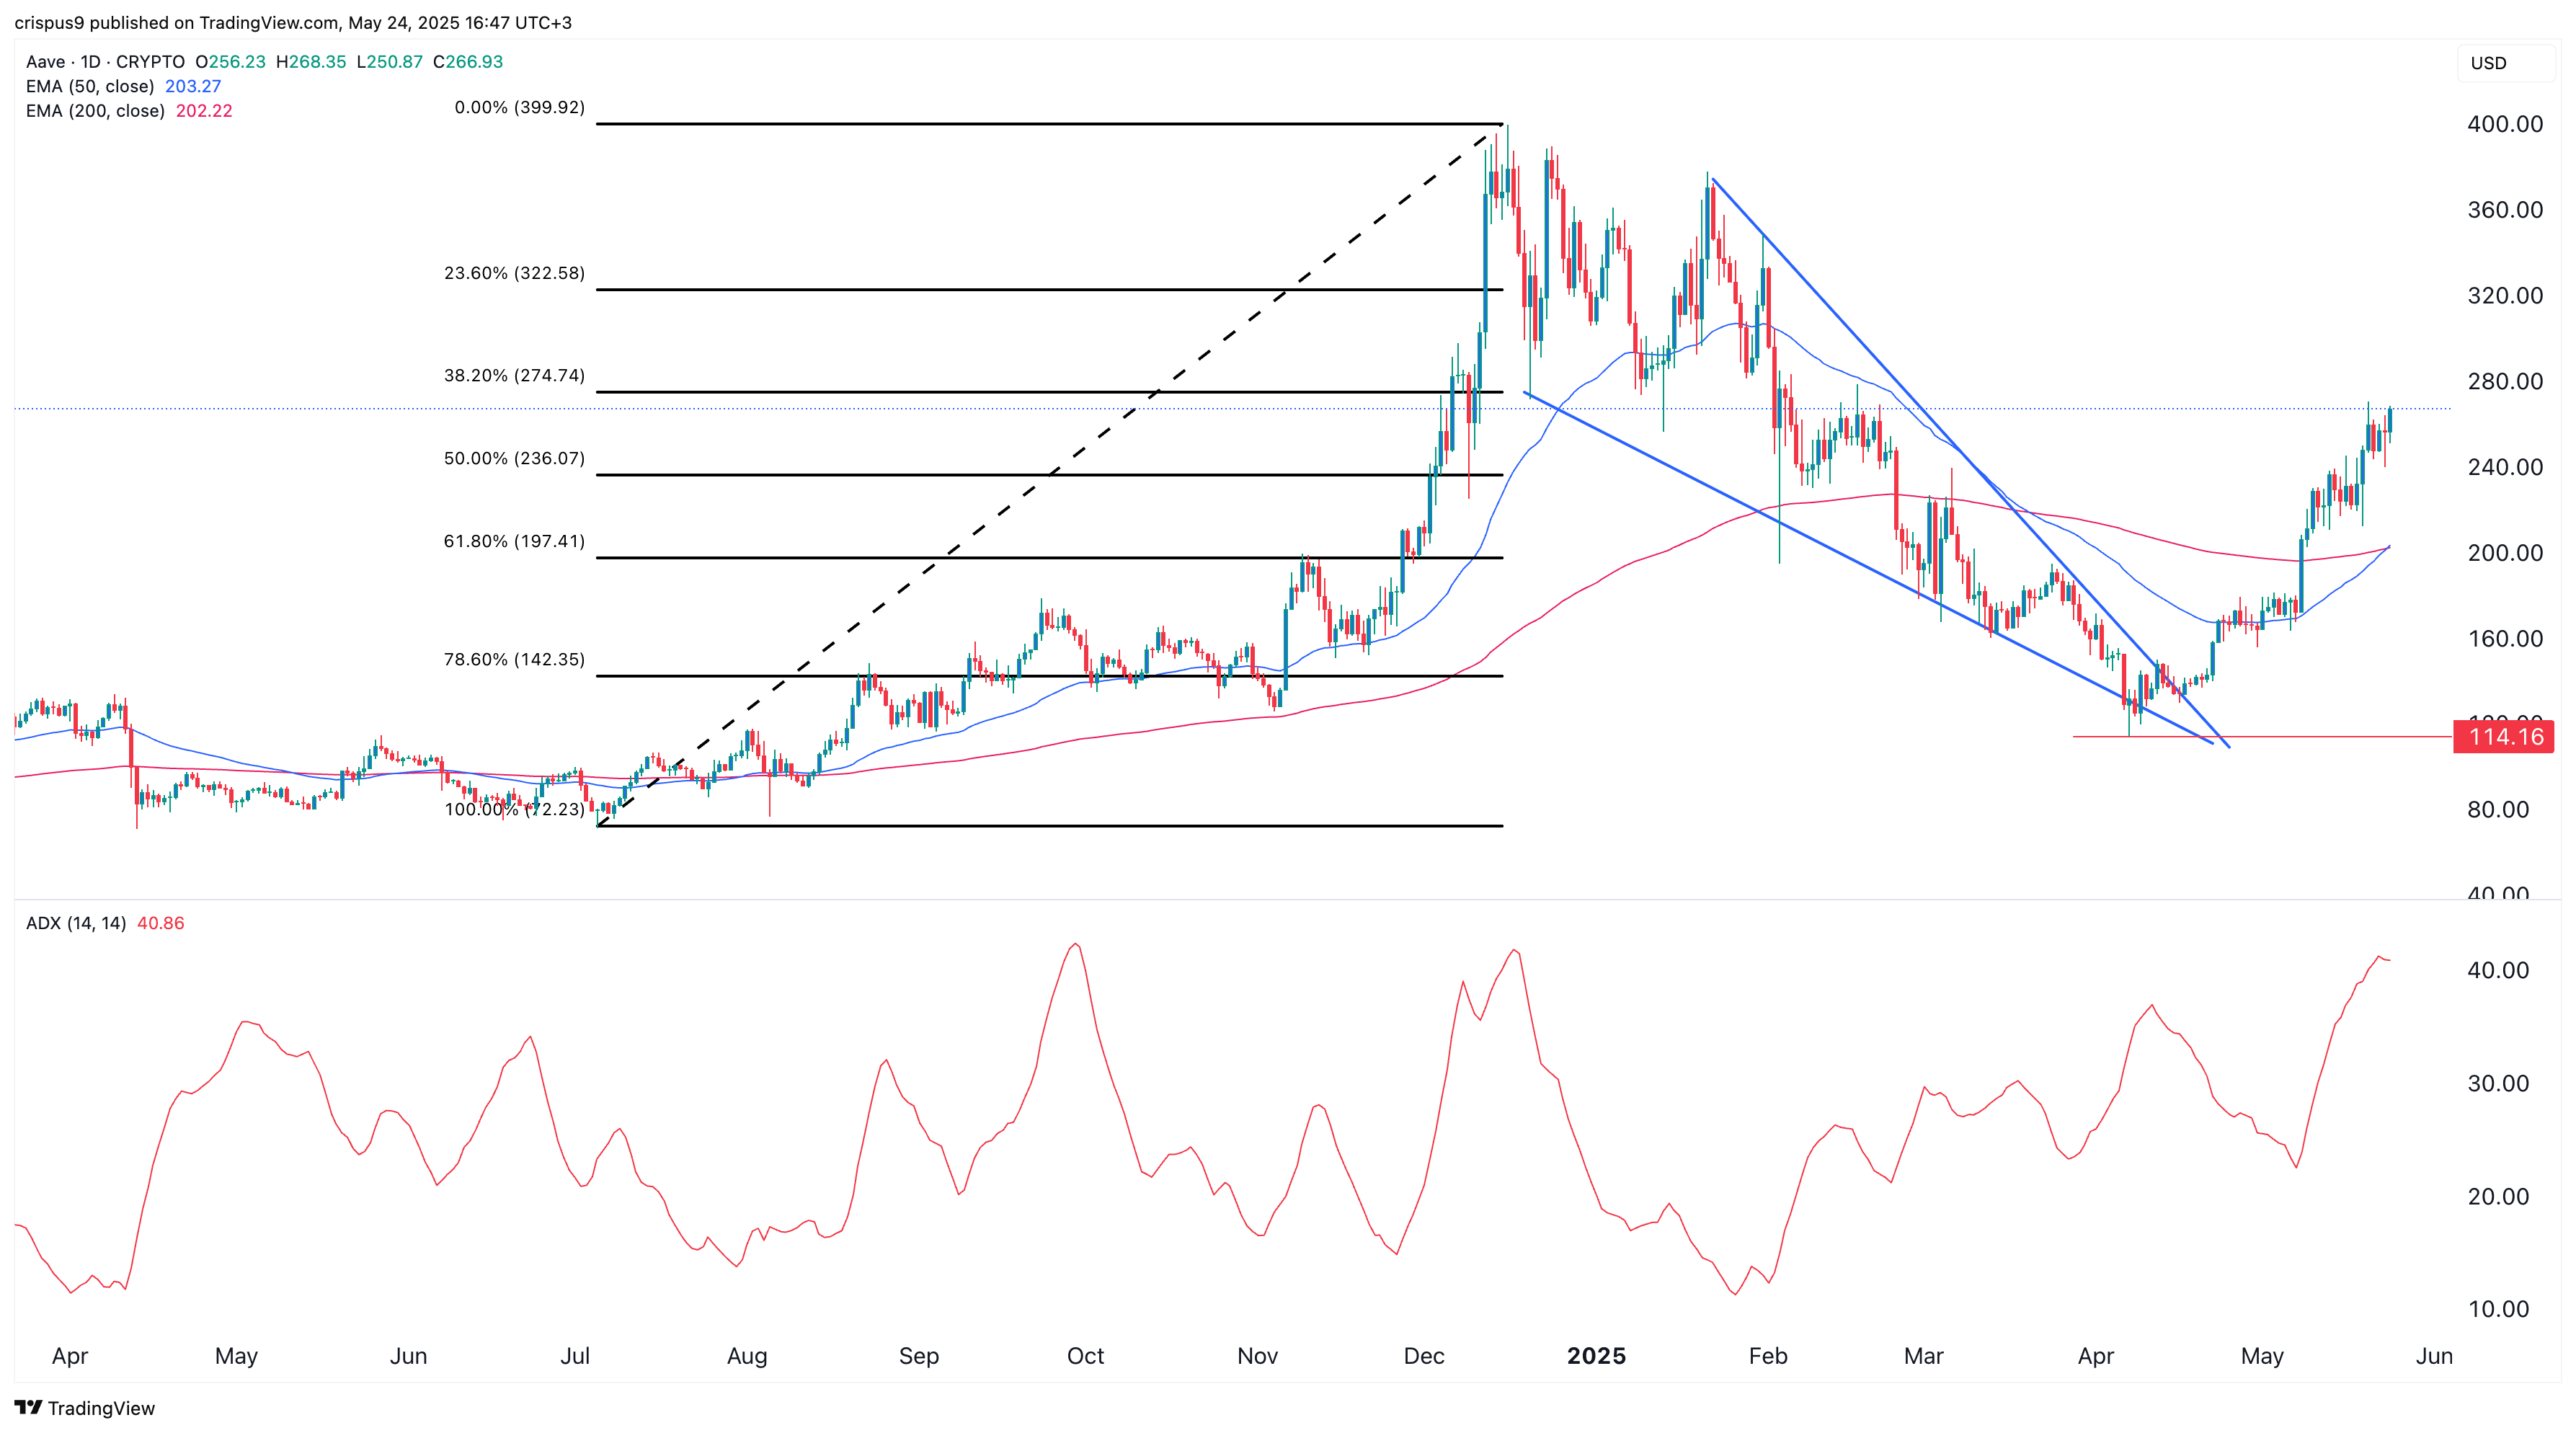
The daily chart shows that Aave Price has soared in the past few weeks. This rebound happened after it formed a falling wedge pattern, a popular bullish reversal sign.
It has now moved above the 50% Fibonacci Retracement level, while the Average Directional Index has moved to 40. An ADX figure of over 25 indicates that the trend is strengthening.
AAVE has formed a golden cross as the 50-day and 200-day moving averages cross each other. Therefore, the path of the least resistance for AAVE is bullish, with the next point to watch being the last November high of $400.
