Dogecoin Whales Are Back—And Price Charts Scream Bullish

Dogecoin’s on-chain metrics show whales loading up bags again—just as technical patterns hint at a looming breakout. The meme coin that refuses to die might be prepping for another absurd run.
Key signals: Whale wallets accumulating, historical support levels holding firm, and that eerie similarity to the 2021 pre-pump structure. Meanwhile, Bitcoin maximalists scoff—until their ’serious’ portfolios get outraced by a Shiba Inu joke again.
Cynical take: Nothing says ’healthy market’ like speculative capital flooding into an asset whose founder called it ’the most ridiculous thing’ three years ago. Strap in.
Whale accumulation is continuing
One of the top leading indicators in crypto fundamental analysis is whale activity. Whales, or large investors, are often seen as being more sophisticated and experienced players in the crypto market.
In most cases, these whales accumulate when they expect that an asset’s price will bounce back and short when they see it falling.
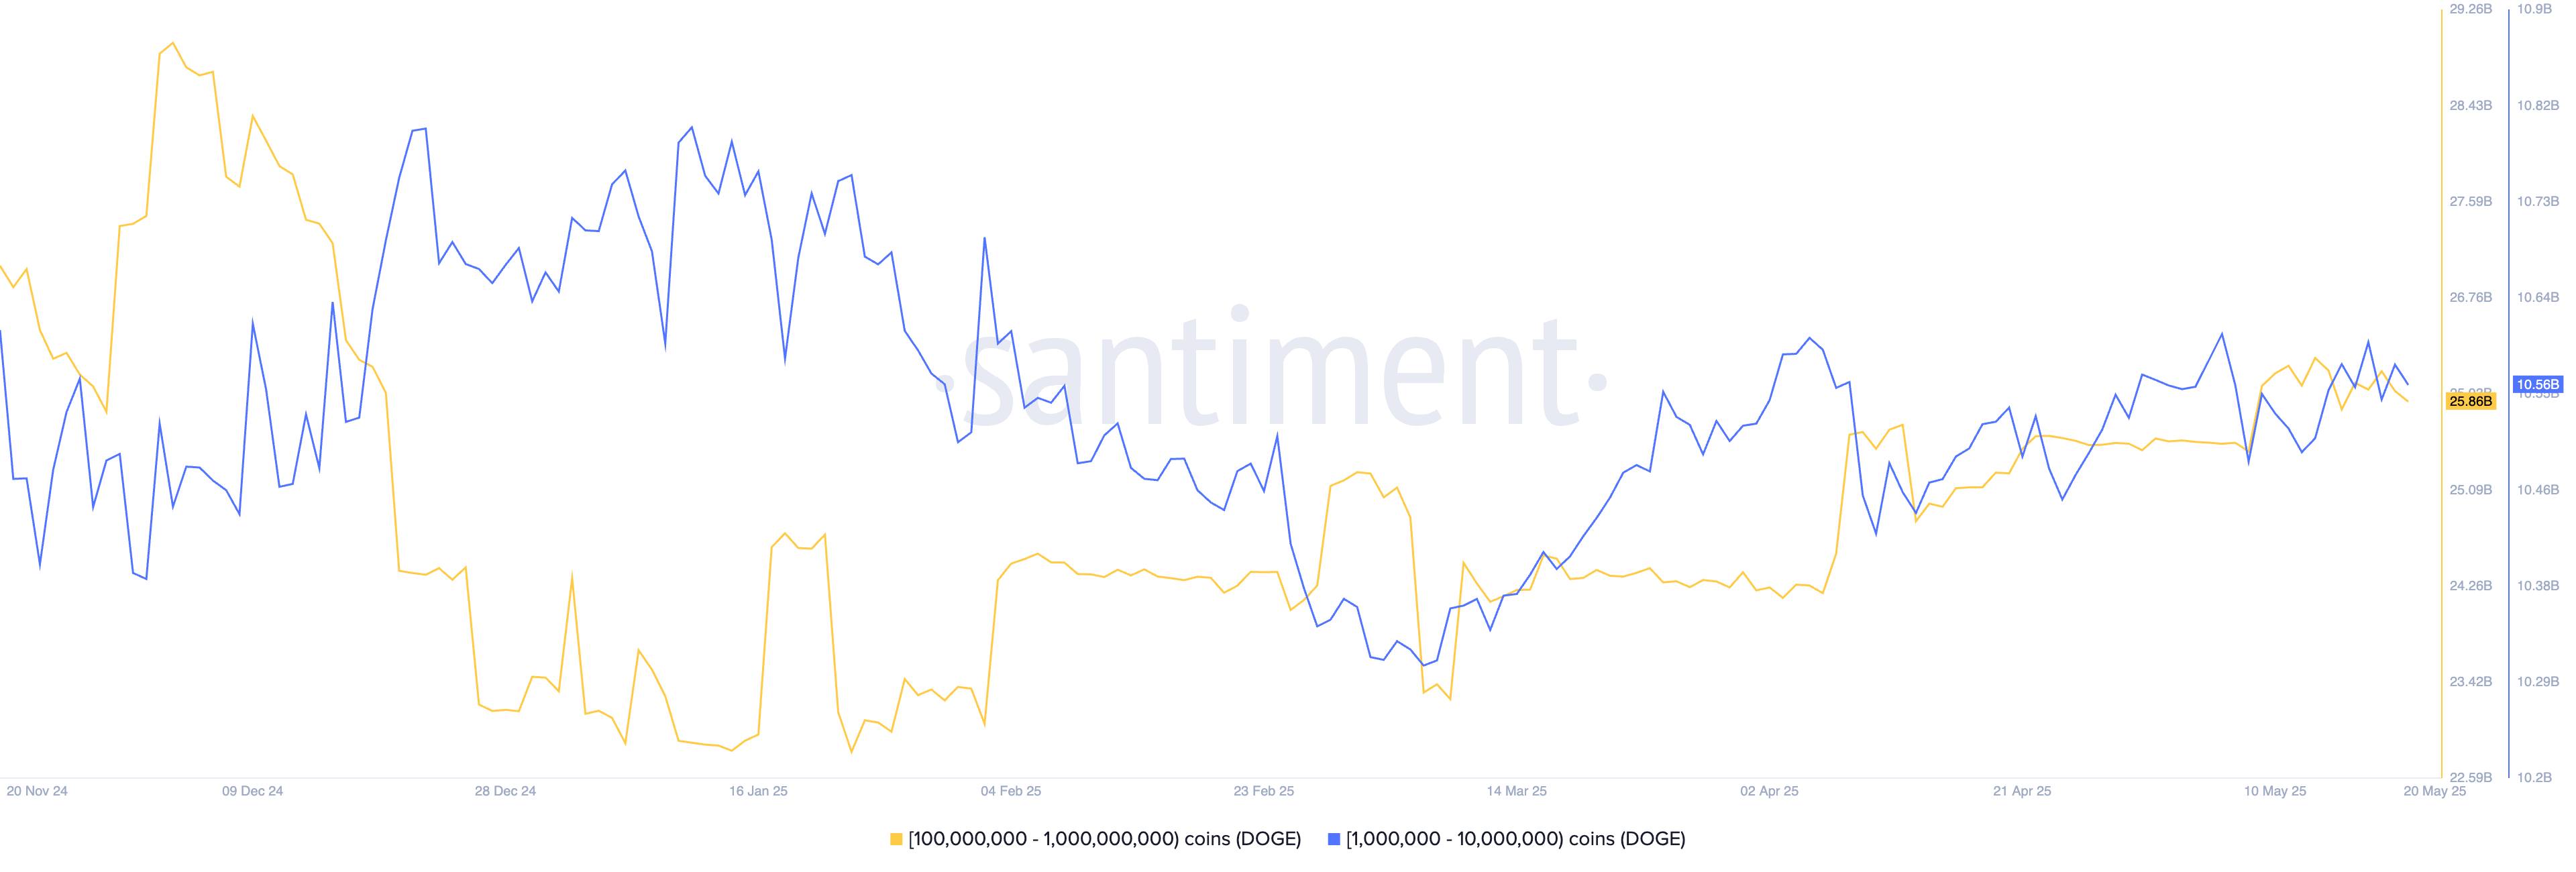
Data shows that Dogecoin whales have started buying it. Santiment data reveals that addresses with between 1 million and 10 million DOGE coins hold 10.56 billion coins, up from 10.48 billion on May 10.
Similarly, addresses holding between 100 million and 1 billion tokens now hold 25.86 billion coins, an increase from 25.53 billion earlier this month.
Dogecoin price formed a bullish flag pattern
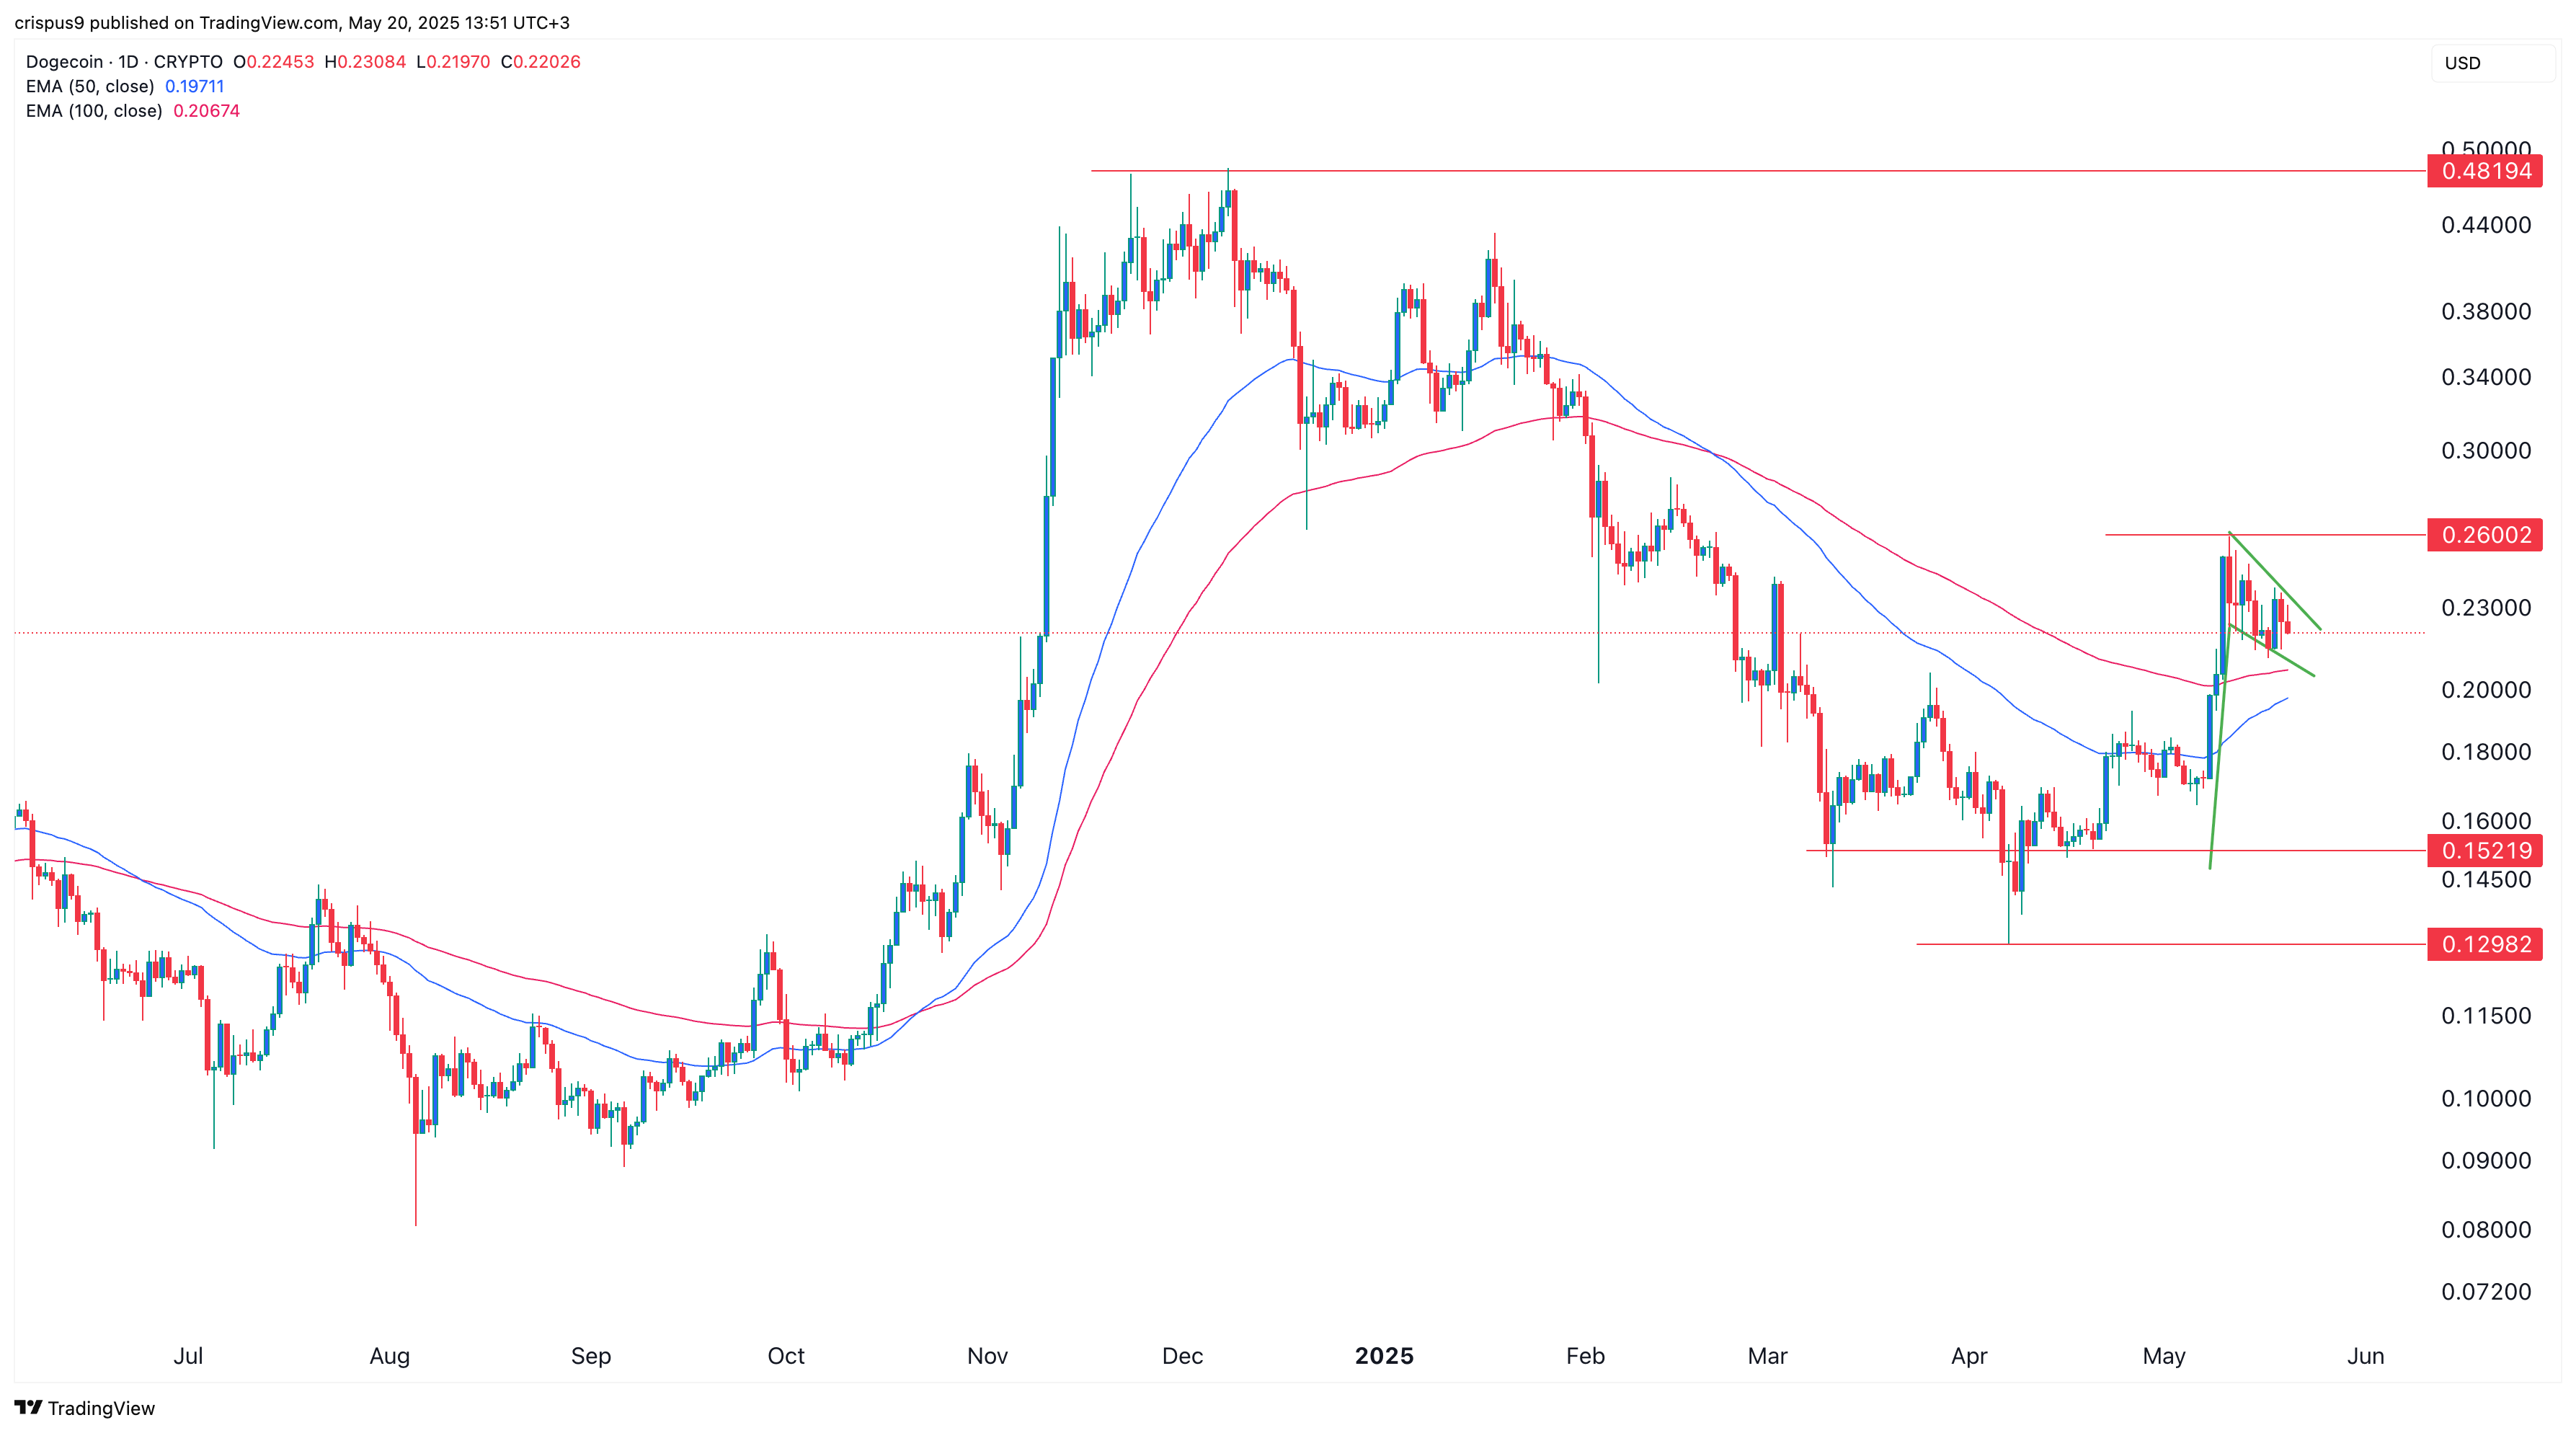
The daily chart shows that the Dogecoin price peaked at $0.2600 last week and then embarked on a downward trend to $0.2200 today.
It has formed a bullish flag chart pattern, a popular continuation sign. This pattern comprises a vertical line and a consolidation that resembles a hoisted flag. In most cases, this pattern results into a strong breakout.
Before this flag happened, Doge price also formed an inverse head and shoulders pattern. The head section was at $0.1298, its lowest point on April 7, while the shoulders were at $0.1520.
Dogecoin has also moved above the 50-day and 100-day Exponential Moving Averages. Therefore, the coin will likely break out and then hit the November 2024 high of $0.4820, up by 120% from the current level.
DOGE price forms giant megaphone on the weekly chart
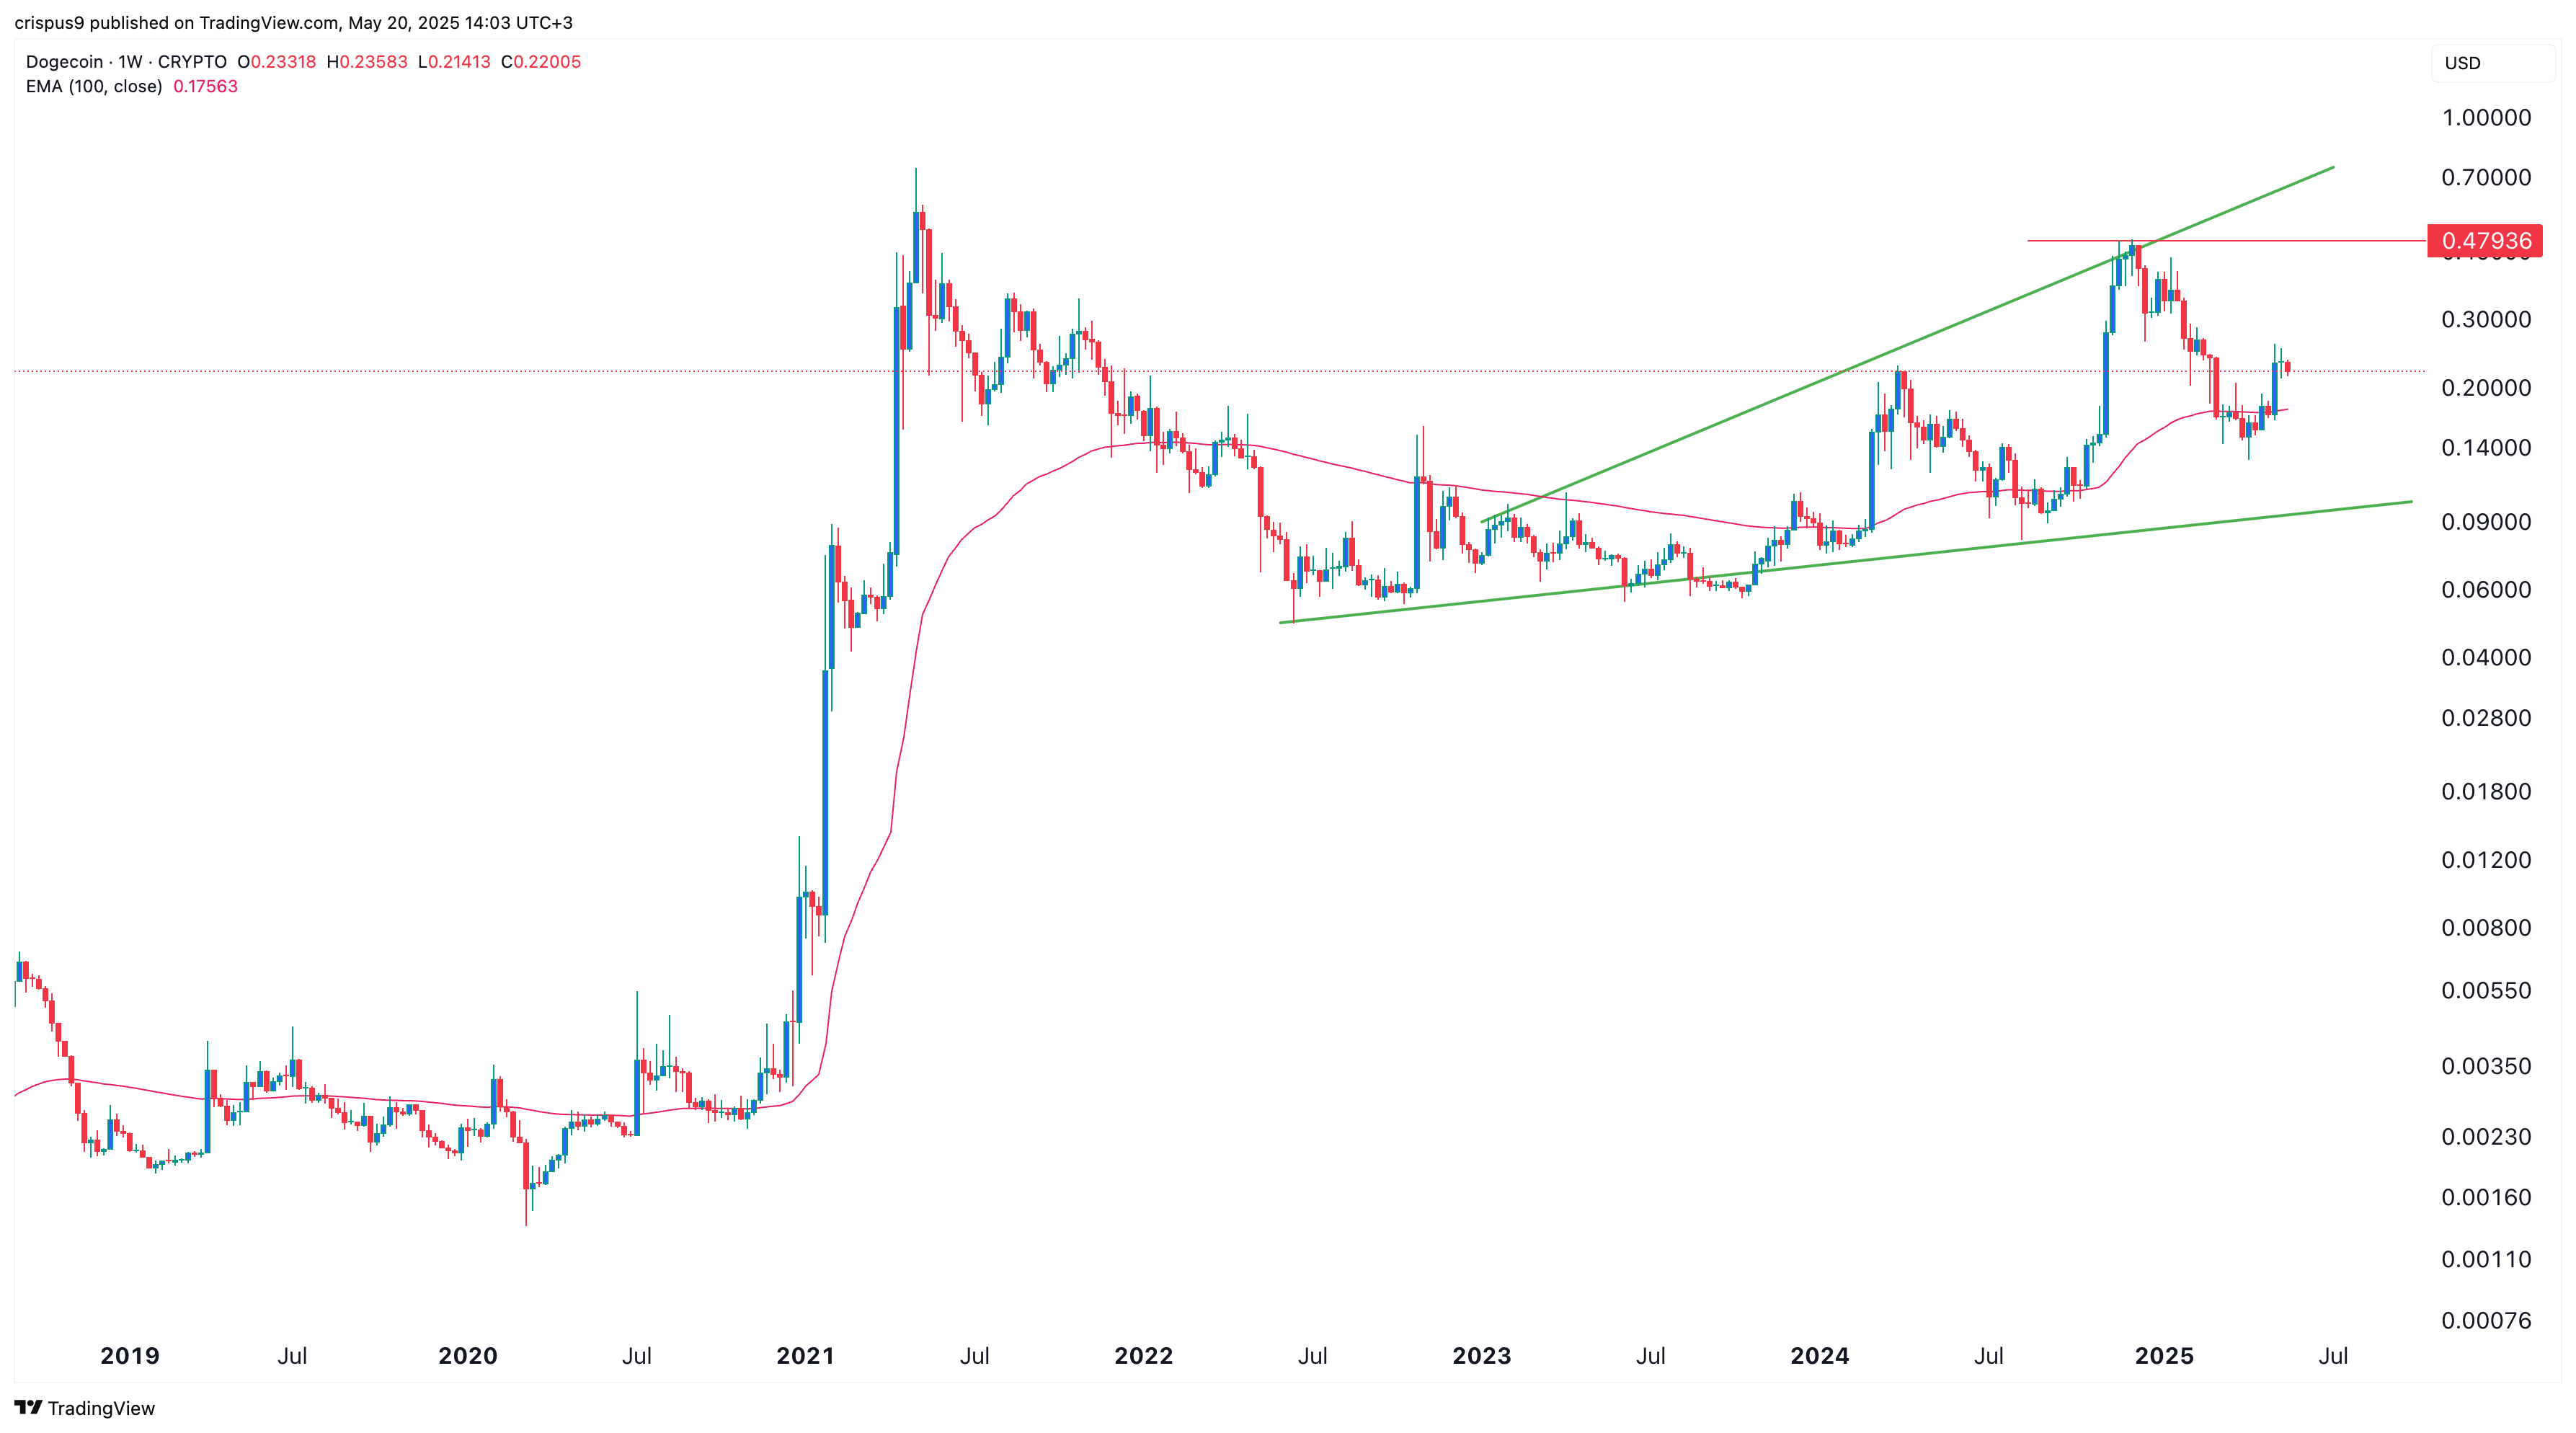
The weekly chart also points to more dogecoin price gains as it has formed a giant megaphone pattern. This pattern is made up of two ascending and diverging trendlines.
In this case, the lower line connects the lowest swing since January 2022, while the upper one links the higher highs since January 2023.
The pattern also usually leads to more gains. If this happens, the first point to watch will be at $0.4820. A MOVE above that level will signal more upside, potentially to the psychological point at $1.
