Solana Gets Smacked Down at $180—Now Traders Sweat the $125 Safety Net

Solana’s rally just hit a brick wall at the $180 resistance level—classic crypto volatility at work. Now all eyes are laser-focused on whether the $125 support will hold or if we’re in for another ’buy the dip’ circus.
Technical traders are flipping charts while retail investors nervously check their portfolios. Meanwhile, Wall Street suits sip lattes and whisper ’I told you so’ about crypto’s mood swings.
Next move? Either a bullish bounce or another painful lesson in crypto’s favorite game: support becomes resistance. Place your bets.
Key technical points
- Resistance Deviation: Price action showed a counter candle close above $180, followed by a close below, confirming a rejection at this resistance.
- Support Zone: $125 represents a major macro daily support level that acts as a technical high or low on the longer-term trend.
- Moving Average Watch: The 200-day moving average is a critical level; losing it would increase the likelihood of further downside momentum.
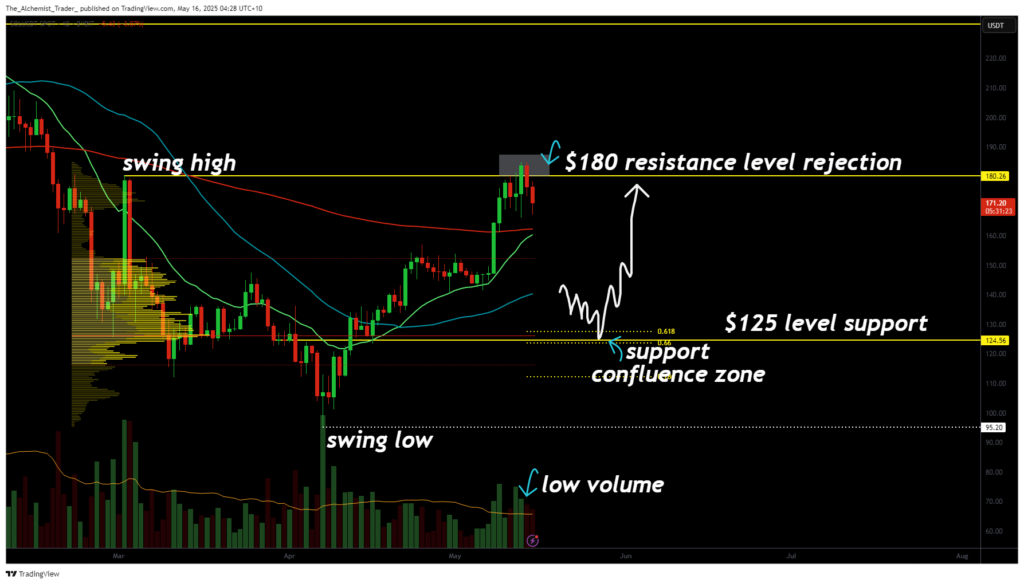
The recent price action near $180 is a textbook example of a deviation, where an initial bullish close above resistance is immediately reversed by selling pressure. This signals that bulls are struggling to break through, and $180 remains a firm ceiling. If this level is not reclaimed decisively, the probability of a deeper pullback increases.
The next major area to watch is the $125 support zone. This level holds significant technical weight, as it coincides with prior macro support on the daily timeframe. Traders often consider such zones strong entry points, anticipating a bounce or reversal following a healthy correction within an overall bullish structure. This reflects the concept of “bullish selling,” where pullbacks into support are seen as part of a sustained uptrend.
In addition, the 200-day moving average is acting as dynamic support. A breakdown below this level WOULD signal a shift in momentum and likely accelerate downside pressure toward $125.
What to expect in the coming price action
For now, solana remains under pressure at the $180 resistance and has not yet reclaimed the level. If $180 continues to hold as resistance and Solana breaks below the 200-day moving average, expect a rotation toward the $125 support zone.
This potential dip may offer a high-probability long opportunity, setting up a trade from $125 back toward $231. On the flip side, a strong reclaim of $180, especially on high volume, would invalidate the bearish scenario and re-establish bullish momentum. Traders should closely monitor volume trends and moving average levels for confirmation.
