Solana’s Rare Chart Pattern Signals Explosive Rally—Just as Traders Max Out Leverage

Solana (SOL) bulls are stacking gains as a textbook technical formation hints at more upside. The ’rare pattern’—likely a Wyckoff accumulation or bull flag—has historically preceded 50%+ SOL runs. Meanwhile, perpetual swaps funding rates hover near neutral, suggesting room for speculative frenzy.
Key levels to watch: A clean break above $200 could trigger algorithmic buying sprees, while $180 acts as support. Meme coin degens are already rotating capital from Ethereum L2s—because why pay $10 in gas when Solana offers sub-penny transactions?
Cynical take: Wall Street ’advisors’ will discover this chart next week—right after their clients FOMO in at the local top.
Solana price technical analysis
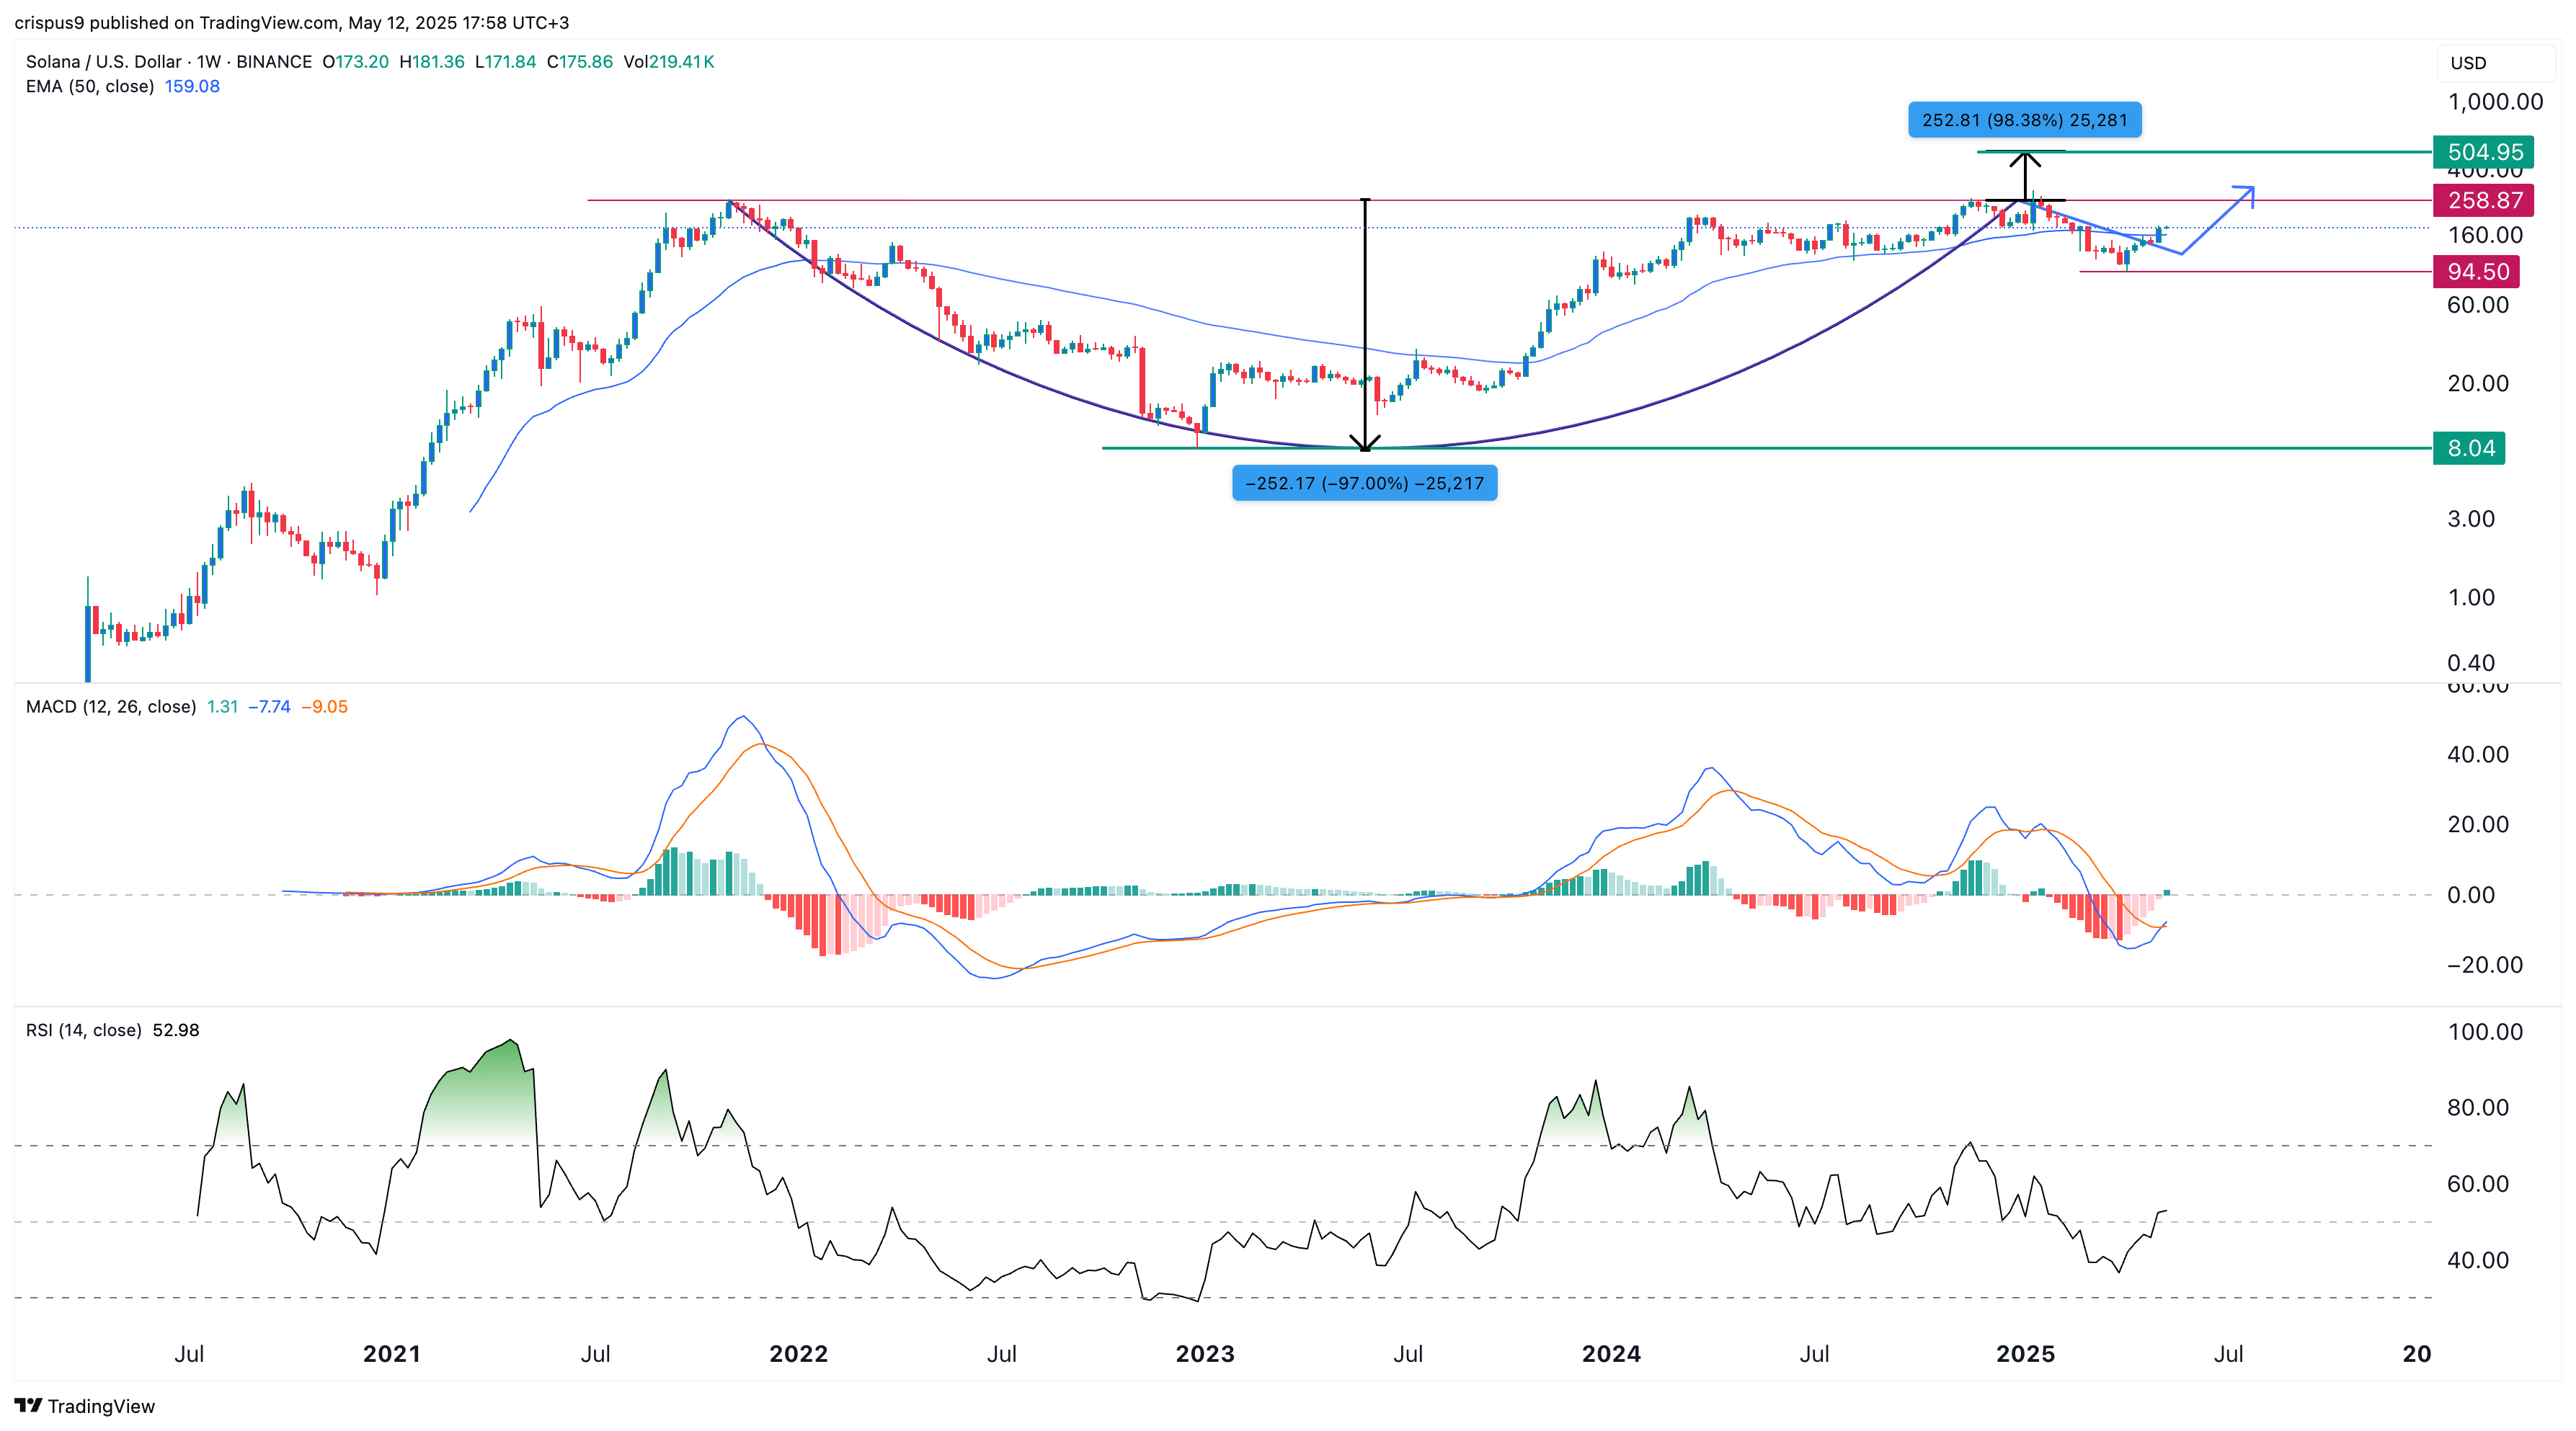
The weekly chart shows that Solana has rallied from last month’s low of $94.50 to $176. It remains slightly below the critical resistance level at $258, which marks the upper boundary of the cup-and-handle pattern that has been forming since November 2021.
Solana has stayed above the 50-week moving average, while both the Relative Strength Index (RSI) and the MACD are pointing upward.
The cup has a depth of about 97%, suggesting a potential price target of $500. This target is derived by projecting the same distance from the top of the cup. A drop below the lower boundary of the handle at $94.50 WOULD invalidate the bullish outlook.

Log in to Reply
Log in to comment your thoughtsComments
Related Articles
|Square
Get the BTCC app to start your crypto journey
Get started today Scan to join our 100M+ users