Pepe Coin Eyes Record High as Double Bottom Pattern Signals Explosive Rally

Meme coin Pepe (PEPE) flashes bullish signals as its chart forms a textbook double bottom—a classic reversal pattern that often precedes major breakouts. Traders are betting this frog-themed crypto could leap past its previous all-time high.
Technical analysts point to the $0.0000085 support level holding firm through two separate tests, creating a springboard for potential 2-3x gains. Volume trends suggest accumulation by whales while retail traders remain distracted by Bitcoin ETFs.
Of course, in crypto land, ’technical analysis’ is just astrology for finance bros—but when the pattern aligns with perpetual futures funding rates flipping positive, even skeptics pay attention. The real question: Will this surge outlast the average memecoin hype cycle?
Pepe price technical analysis
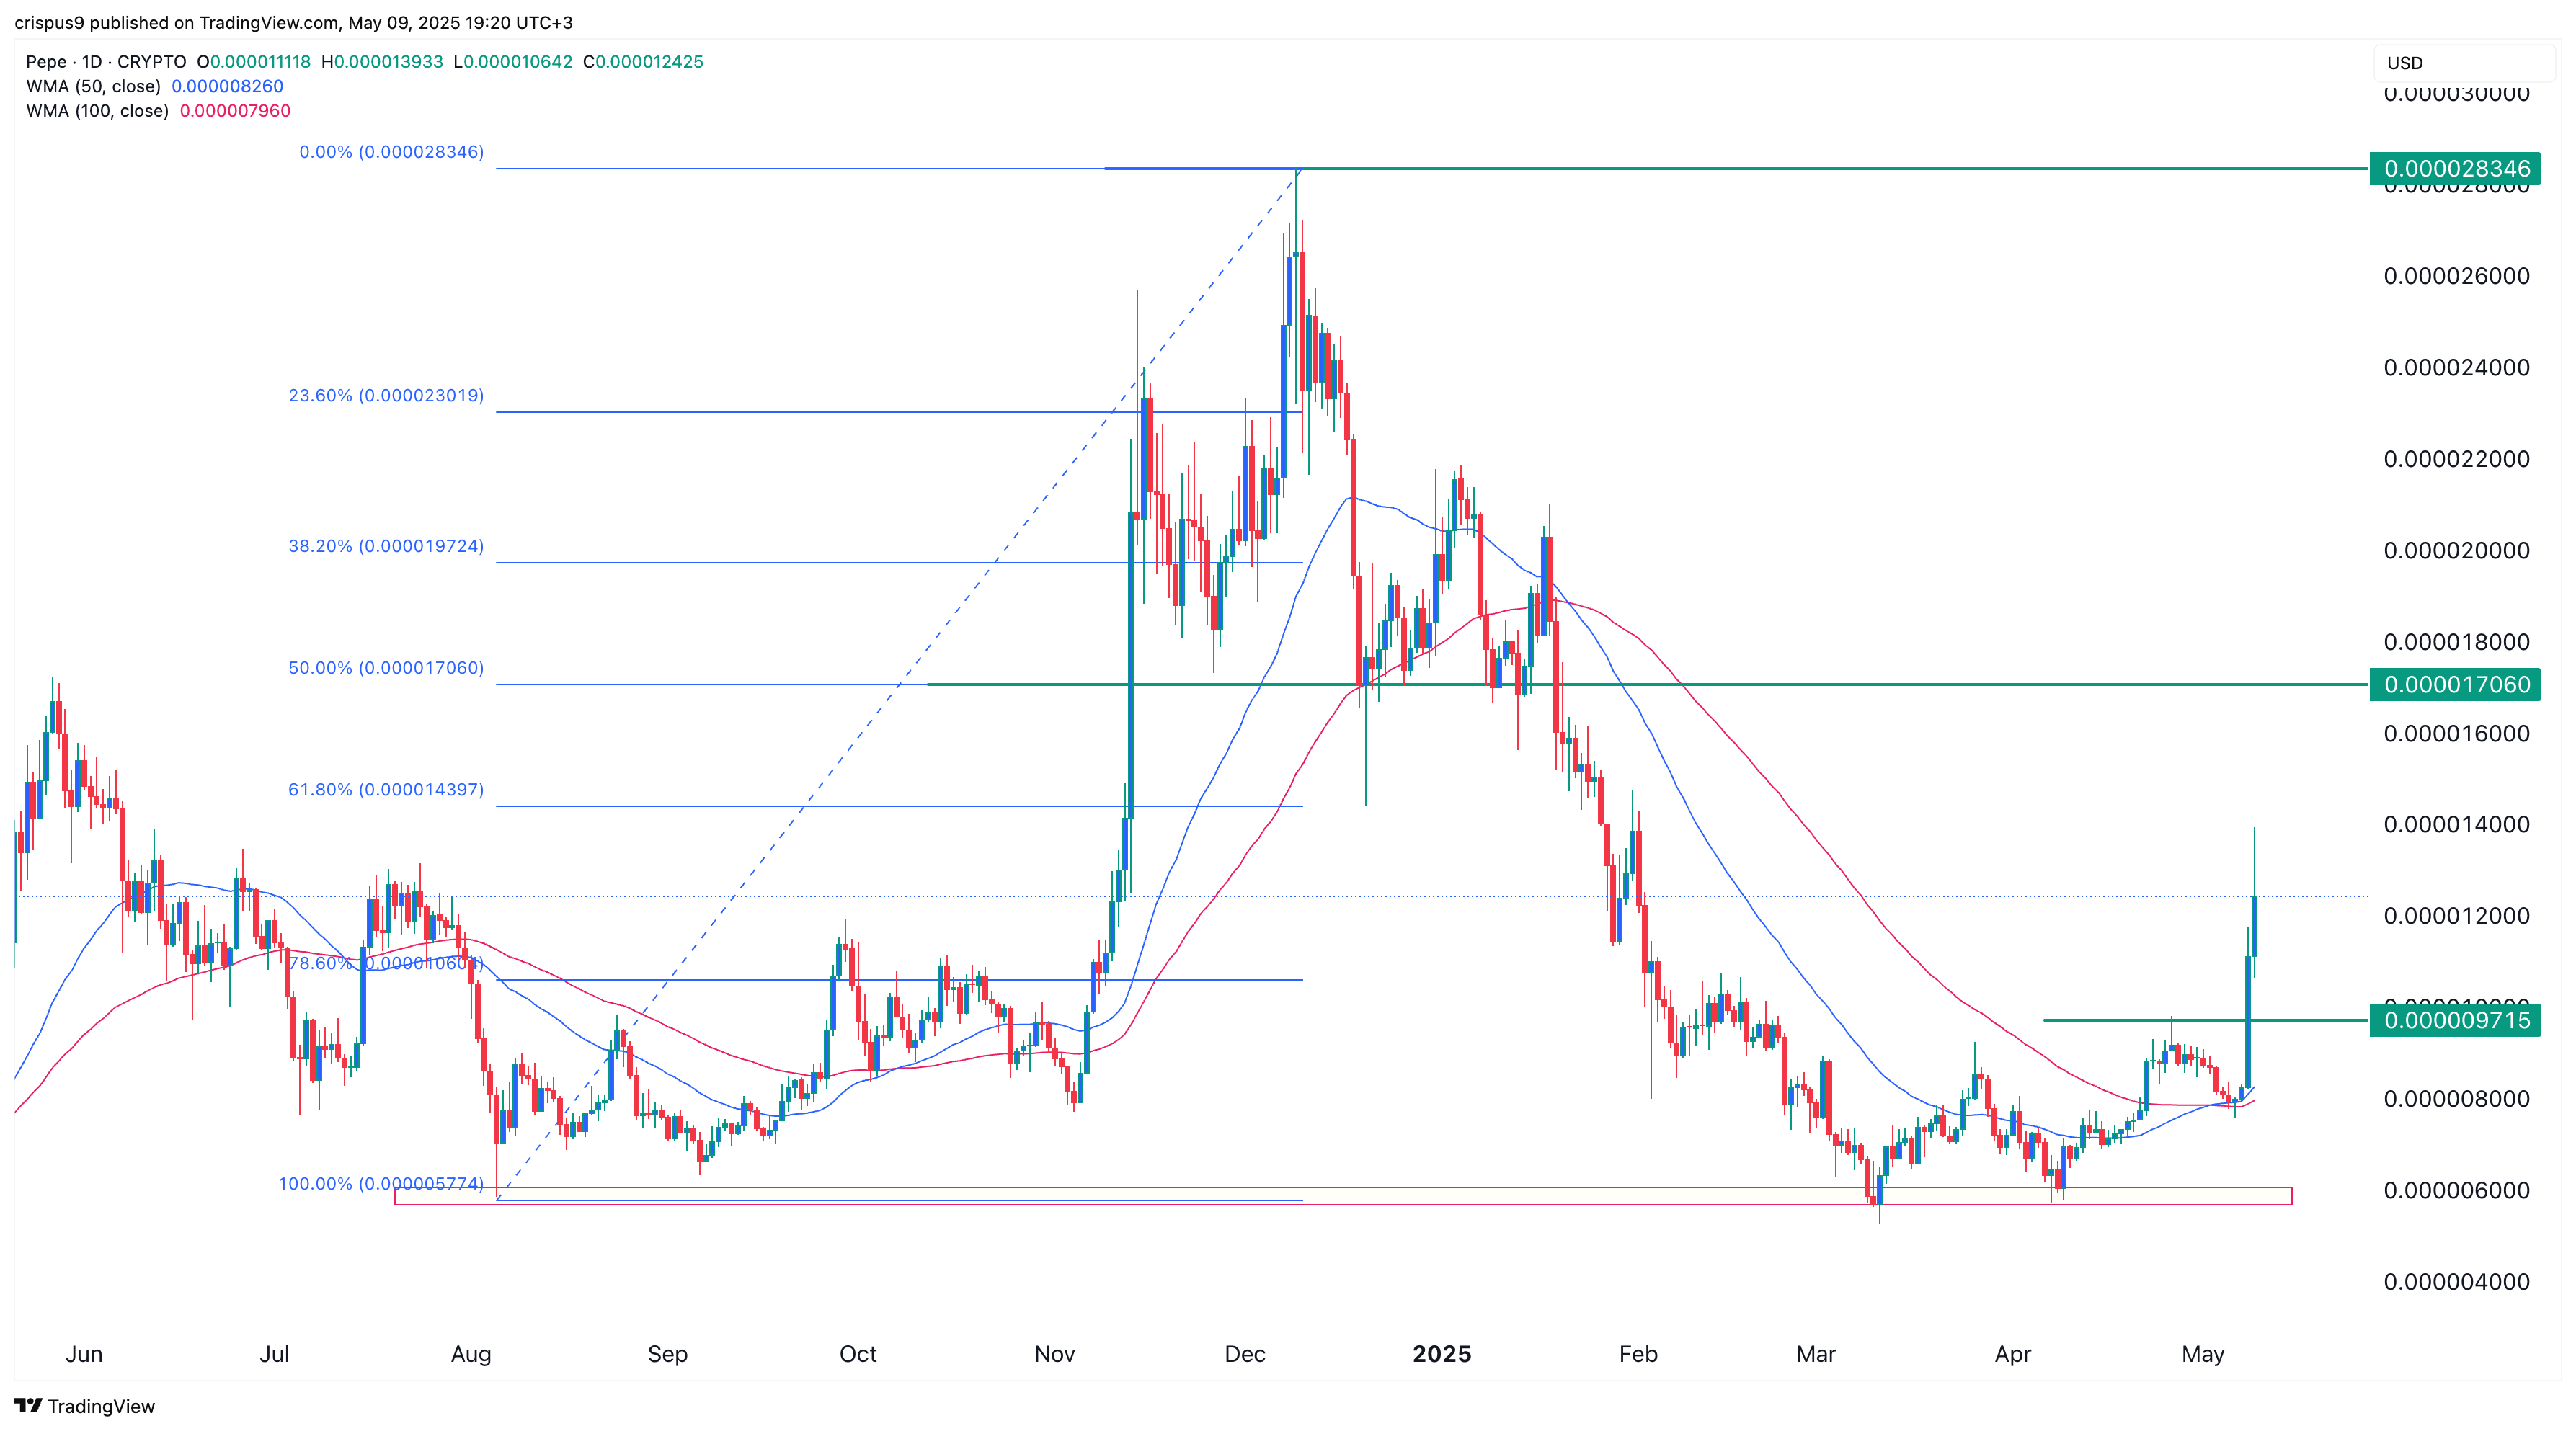
The daily chart shows that Pepe found a strong bottom around the $0.000060 level throughout 2024. It has failed to break below this price at least three times, forming a triple-bottom pattern with a neckline at $0.00002835, its all-time high. A triple bottom is a popular bullish reversal pattern.
Pepe has also formed a mini golden cross pattern, with the 50-day and 100-day Weighted Moving Averages crossing each other.
Therefore, the most likely price action is a short-term drop to retest support at $0.0000097, as retail investors take profits. It may then rebound and target the 50% Fibonacci Retracement level at $0.000017. A breakout above that level could open the door for more gains, potentially retesting its all-time high at $0.00002835.
