Chainlink (LINK) Exhibits Bullish Divergence Amid Surging Exchange Withdrawals

As of April 19, 2025, Chainlink’s native token LINK is showing signs of a bullish technical divergence, coinciding with a notable increase in outflows from centralized exchanges. This trend suggests growing accumulation by long-term holders, potentially reducing available supply on trading platforms. Market analysts interpret these on-chain movements as a precursor to upward price action, particularly when paired with LINK’s recent consolidation below key resistance levels. The divergence between exchange netflows and price stability often precedes volatile breakouts in crypto assets, with LINK’s robust oracle network fundamentals adding credence to the bullish thesis.
Chainlink price technical analysis
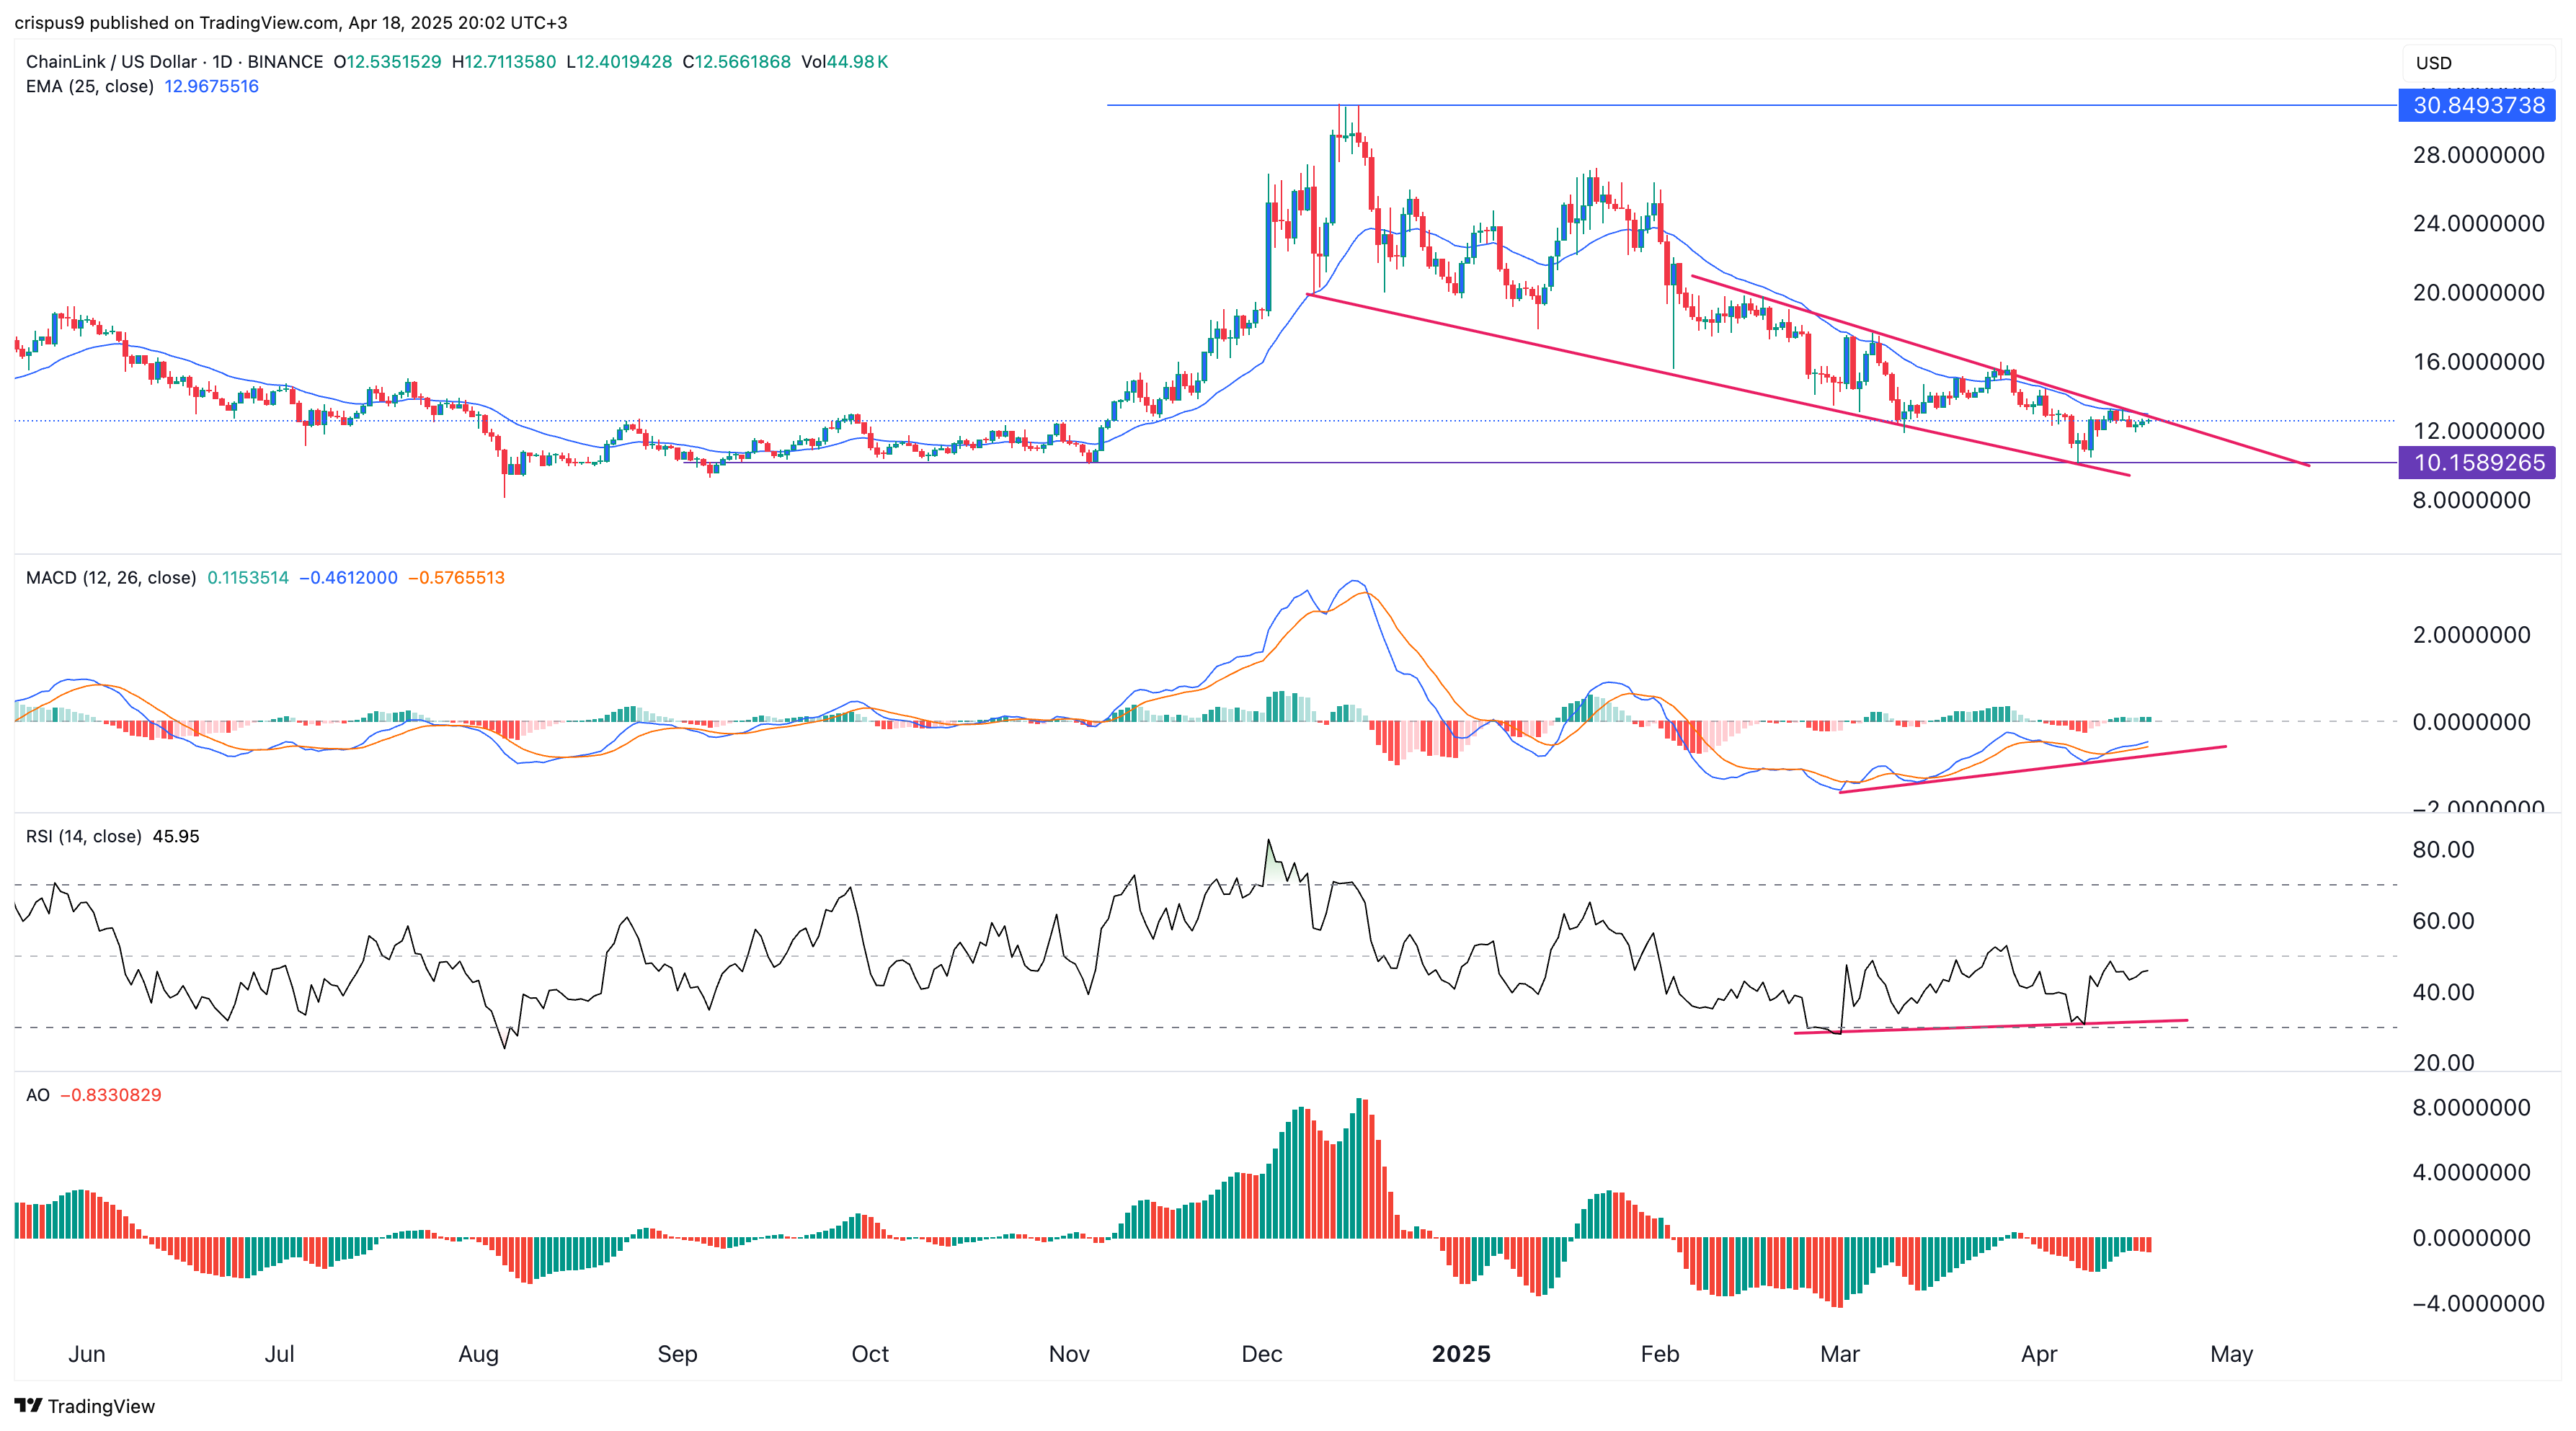
The daily chart shows that LINK has been in a strong downtrend over the past few months. It dropped from a high of $30.80 in November to a low of $10.15 this month, its lowest level since November last year.
Chainlink has retested a key resistance level that it has struggled to break above since February 13. It has also formed a falling wedge-like pattern, a common bullish reversal signal in technical analysis.
Additionally, LINK has formed a bullish divergence pattern. The MACD indicator, which tracks momentum and trend strength, has continued rising, with its two lines nearing the zero level.
The Relative Strength Indexand the Awesome Oscillator have also continued trending higher. Therefore, the coin is likely to stage a bullish breakout, with bulls targeting the psychological level of $15, approximately 15% above the current price.
