BONK Symmetrical Triangle Formation: Is a Major Price Breakout on the Horizon?

As of April 19, 2025, the cryptocurrency BONK is exhibiting a compelling symmetrical triangle pattern on the charts, signaling a potential high-volatility breakout. Traders and analysts are closely monitoring this technical setup, which often precedes significant price movements. The tightening price range suggests diminishing volatility before a decisive directional move, with key support and resistance levels converging. Market participants are evaluating whether this consolidation phase will culminate in a bullish or bearish breakout, with implications for short-term trading strategies. The current technical posture warrants attention given the pattern’s historical reliability in predicting substantial price swings in crypto assets.
Bonk’s Recent Price Action: The Setup For A Big Move
According to a recent post by Whales_Crypto_Trading on X (formerly Twitter), Bonk is currently forming a symmetrical triangle pattern on the 1-hour chart. The price has just rebounded from the lower support trendline of the triangle, suggesting that buyers are stepping in to defend the structure and potentially build momentum for an upward breakout.
What makes this pattern particularly noteworthy is the potential upside. Whales_Crypto_Trading highlighted a profit target range of 70–80%, should BONK successfully break above the upper resistance trendline. With volatility tightening and volume starting to show signs of recovery, such a breakout could offer a substantial short-term trading opportunity.
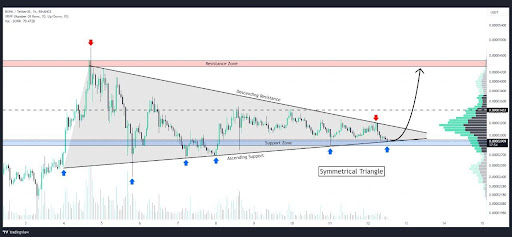
However, traders are advised to keep a close eye on volume confirmation and key breakout levels to avoid possible fakeouts, as symmetrical triangles can break in either direction.
Will The Meme Coin Explode Or Fizzle Out?
Bonk’s symmetrical triangle pattern has reached a critical stage, raising speculations about whether the meme coin will break free with force or lose steam under pressure. The recent bounce off the support trendline suggests bullish interest is still alive, and if momentum continues to build, BONK could be gearing up for a powerful breakout, potentially delivering gains in the 70–80% range as projected by traders.
However, it’s important to remain cautious. Symmetrical triangles are neutral by nature, meaning a breakdown is still on the table if buyers fail to push through resistance. The next few candles on the 1-hour chart could provide key confirmation of BONK’s direction.
In the end, BONK is approaching a defining moment. Whether it explodes into a bullish run or fizzles out into another rejection will largely depend on volume, sentiment, and the strength of the breakout. Traders should stay alert, as a big move may be closer than it seems.
