Bitcoin ETF Exodus Accelerates Following Major Liquidation Wave

Capital flees Bitcoin ETFs as liquidation pressures mount
The Great Unwinding
Bitcoin exchange-traded funds are bleeding assets at an alarming rate—outflows surging just days after a massive liquidation event rocked crypto markets. Institutional players are pulling billions while retail investors watch their screens turn red.
Market Mechanics Exposed
Forced selling triggers cascade effects that even the most sophisticated ETF structures can't withstand. The very vehicles designed to bring stability are now amplifying volatility—because nothing says 'mature asset class' like double-digit percentage swings in a single trading session.
Wall Street's Crypto Conundrum
Traditional finance keeps trying to fit decentralized assets into centralized boxes, and surprise—the boxes keep breaking. Maybe next time they'll remember that Bitcoin doesn't care about your prospectus or your regulatory approvals when the margin calls start flying.
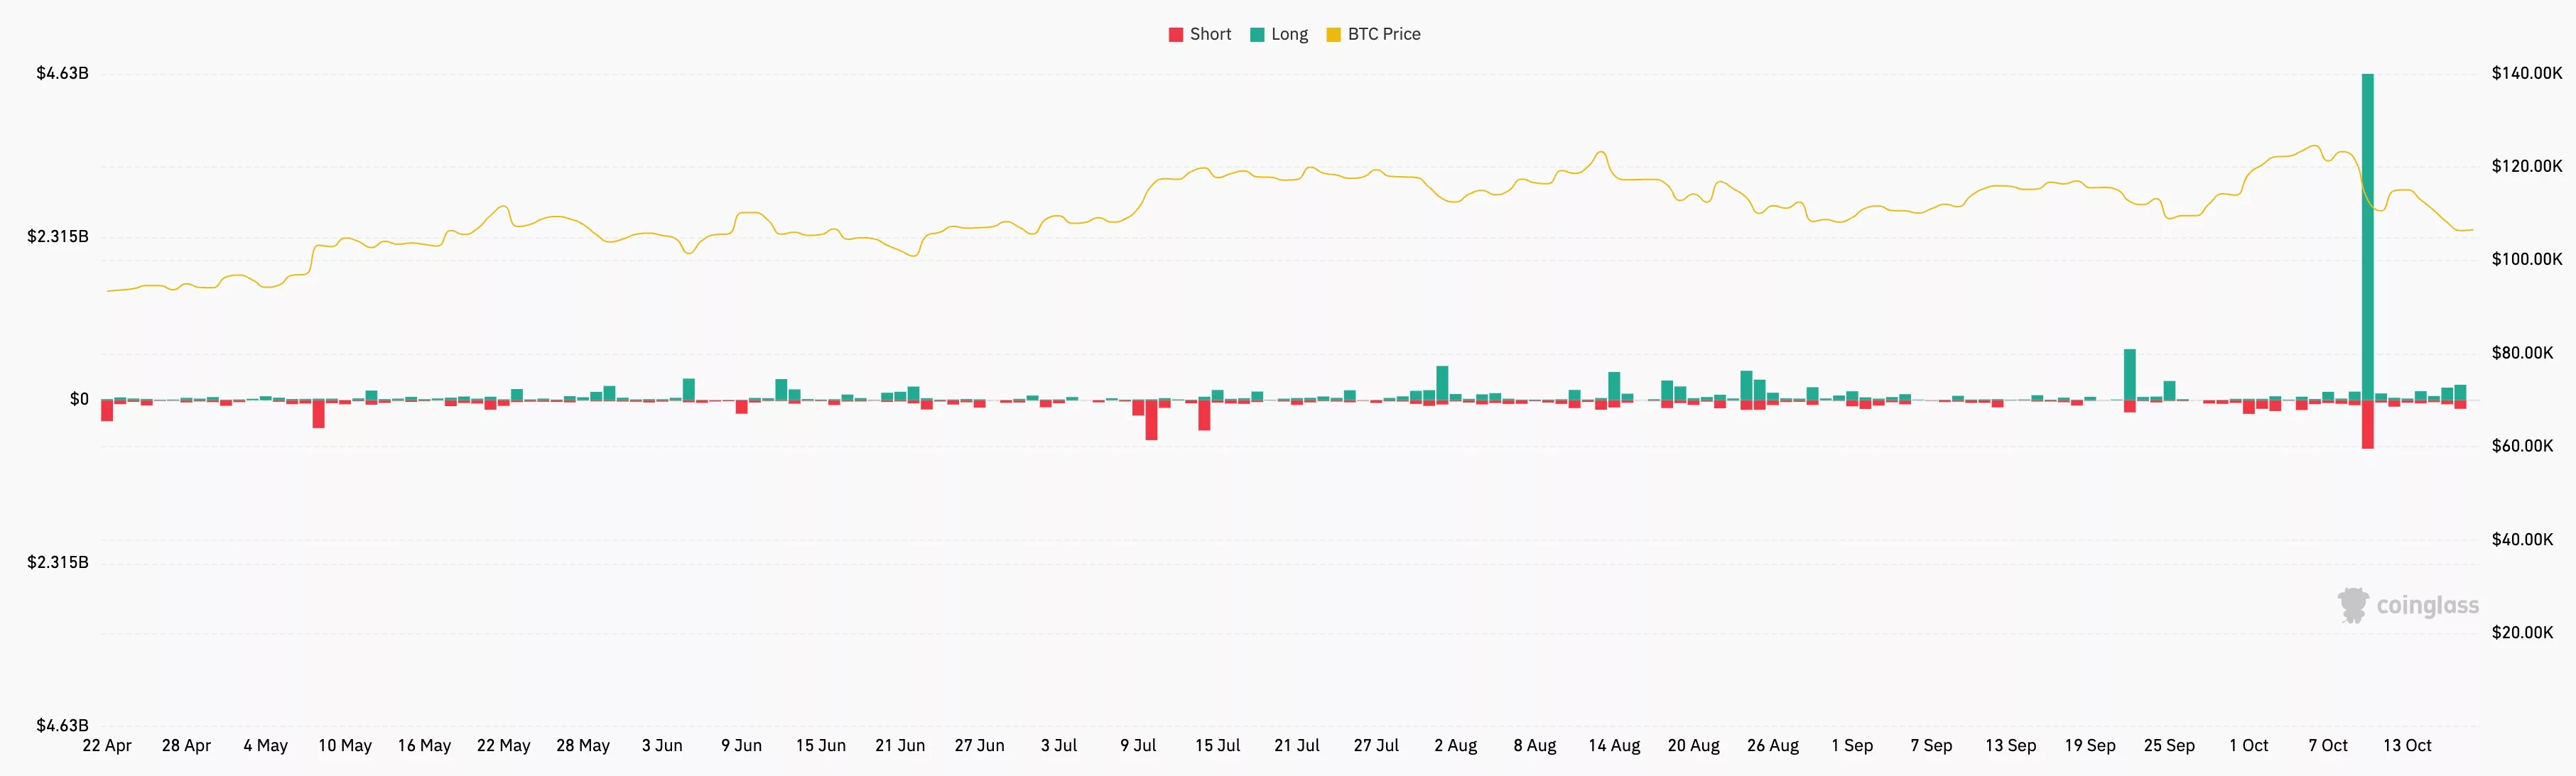 Bitcoin liquidations peaked at $4.65 billion last week | Source: CoinGlass
They also sold Bitcoin as Gold emerged as a better safe-haven asset amid rising risks. There are risks that the trade war between the US and China will escalate, leading to higher inflation, which may prevent the Fed from cutting interest rates.
The other notable risks include the ongoing U.S. government shutdown and credit quality. Credit issues emerged after three regional banks reported fraud-related losses.
Bitcoin price technical analysis
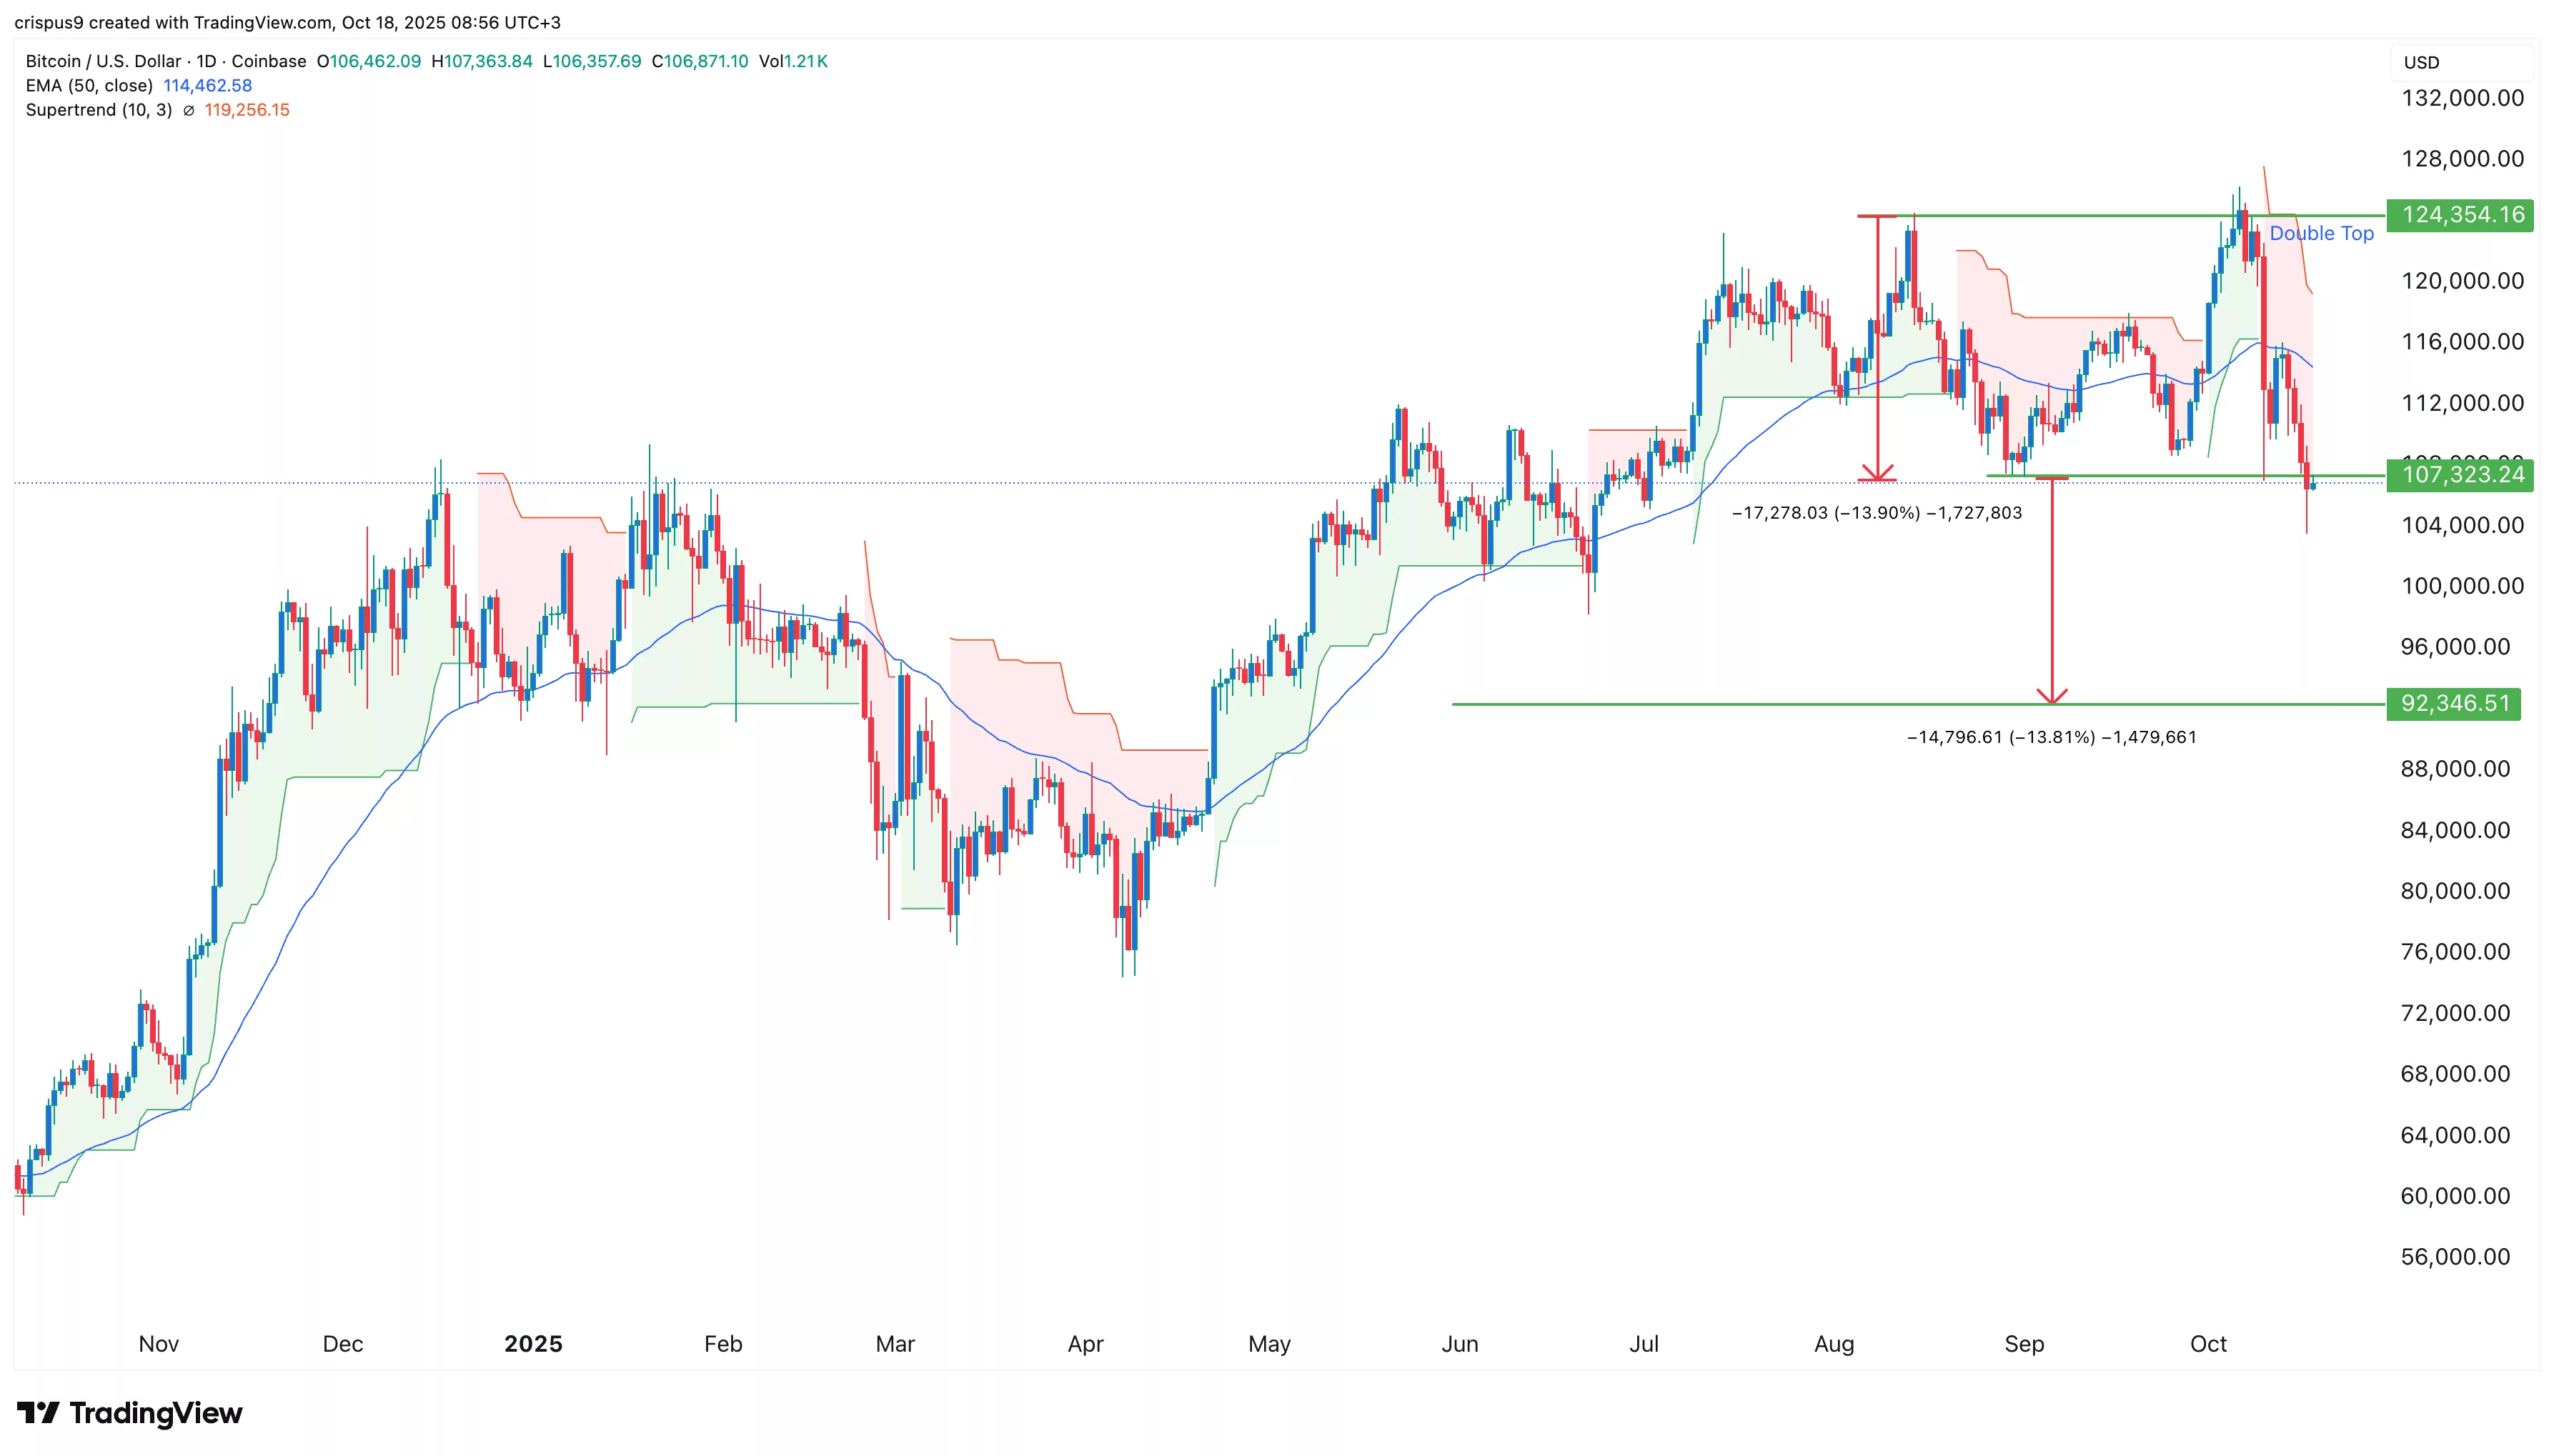
The daily timeframe chart shows that the BTC price remains under pressure after falling by 14% from its highest point this year.
It has crashed below the 50-day moving average, while the Supertrend indicator has turned red. Most notably, the coin has formed a double-top pattern at $124,355.
A double top is one of the most common bearish signs in technical analysis. Its profit target is estimated by measuring the distance between the head and the neckline, and then the same one from the neckline.
In this case, the profit target is about $92,345, its lowest point since April this year. A MOVE above the resistance level at $113,000 will invalidate the bearish outlook.
