XRP’s Spectacular Rebound: From 41% Flash Crash to $2.47 Recovery in Dramatic Market Turnaround

XRP defies gravity with stunning recovery after brutal market plunge
The Phoenix Rises
Just when traders thought the party was over, XRP staged one of the most dramatic comebacks in recent crypto history. After shedding 41% of its value in a terrifying flash crash that left portfolios bleeding, the digital asset clawed its way back to reclaim the crucial $2.47 support level.
Market Mechanics in Motion
Whale movements triggered the initial sell-off—34,000 Bitcoin suddenly in motion created ripples across every major cryptocurrency. The domino effect hit XRP hardest, sending it into freefall before bargain hunters and institutional buyers stepped in. They saw blood in the water and bought the dip with conviction.
Trading Psychology at Play
Fear turned to greed in record time. Retail investors who panicked during the crash watched in horror as prices recovered without them. Meanwhile, seasoned traders who kept their cool are now counting profits—proving once again that in crypto, the biggest rewards go to those with the strongest stomachs.
The Support Level That Matters
$2.47 wasn't just another number on the chart. This psychological barrier became the battleground where bulls and bears fought for control. When XRP reclaimed this level, it sent a clear message: the underlying strength remains intact despite temporary turbulence.
Because nothing says 'stable investment' like watching your portfolio swing 41% in hours while traditional finance executives clutch their pearls and whisper about regulation.
XRP price crash confirms analyst forecast
Ripple (XRP) token plummeted to a low of $1.3758, down by over 63% from its highest point this year. This plunge led to a $700 million surge in liquidations.
The xrp price crashed and then bounced back by over 75% as investors bought the dip. This plunge confirmed what analyst Peter Brandt warned in an X post: “On the left is a classic descending triangle from Edwards and Magee, showing what descending triangles are supposed to do. On the right is a developing descending triangle. ONLY IF it closes below 2.68743 (then I’ll be a hater), then it should drop to 2.22163.”
On the left is a classic descending triangle from Edwards and Magee, showing what descending triangles are supposed to do. On the right is a developing descending triangle. ONLY IF it closes below 2.68743 (then I'll be a hater), then it should drop to 2.22163. $XRP pic.twitter.com/3GI7nT1TaW
— Peter Brandt (@PeterLBrandt) October 7, 2025Brandt’s target price was $2.2, which was hit as the crypto market crashed on Friday.
Hey XRP trolls
Target reached. Profits taken
While you such gas pic.twitter.com/OKANaEaSu7
Cryptocurrencies dropped as investors reacted to the new trade war between the U.S. and China. TRUMP announced a 130% tariff on Chinese goods, with China expected to respond with similar retaliatory measures.
The U.S. president cited the recent actions by Beijing, including blocking soybean imports from the US, new tariffs on U.S. ship docking in China, investigations into U.S. technology companies, and new limits on rare earth exports.
The crypto crash resulted in over $300 billion in losses, as the market capitalization of all coins plummeted to $3.7 trillion. Liquidations jumped to nearly $20 billion in the crypto industry.
Still, XRP price has potential catalysts, including the ongoing ETF inflows and the upcoming spot ETF approvals. Data by ETF.com shows that the XXRP, UXRP, and XRPR ETFs have had substantial inflows since their approvals.
Ripple price technical analysis
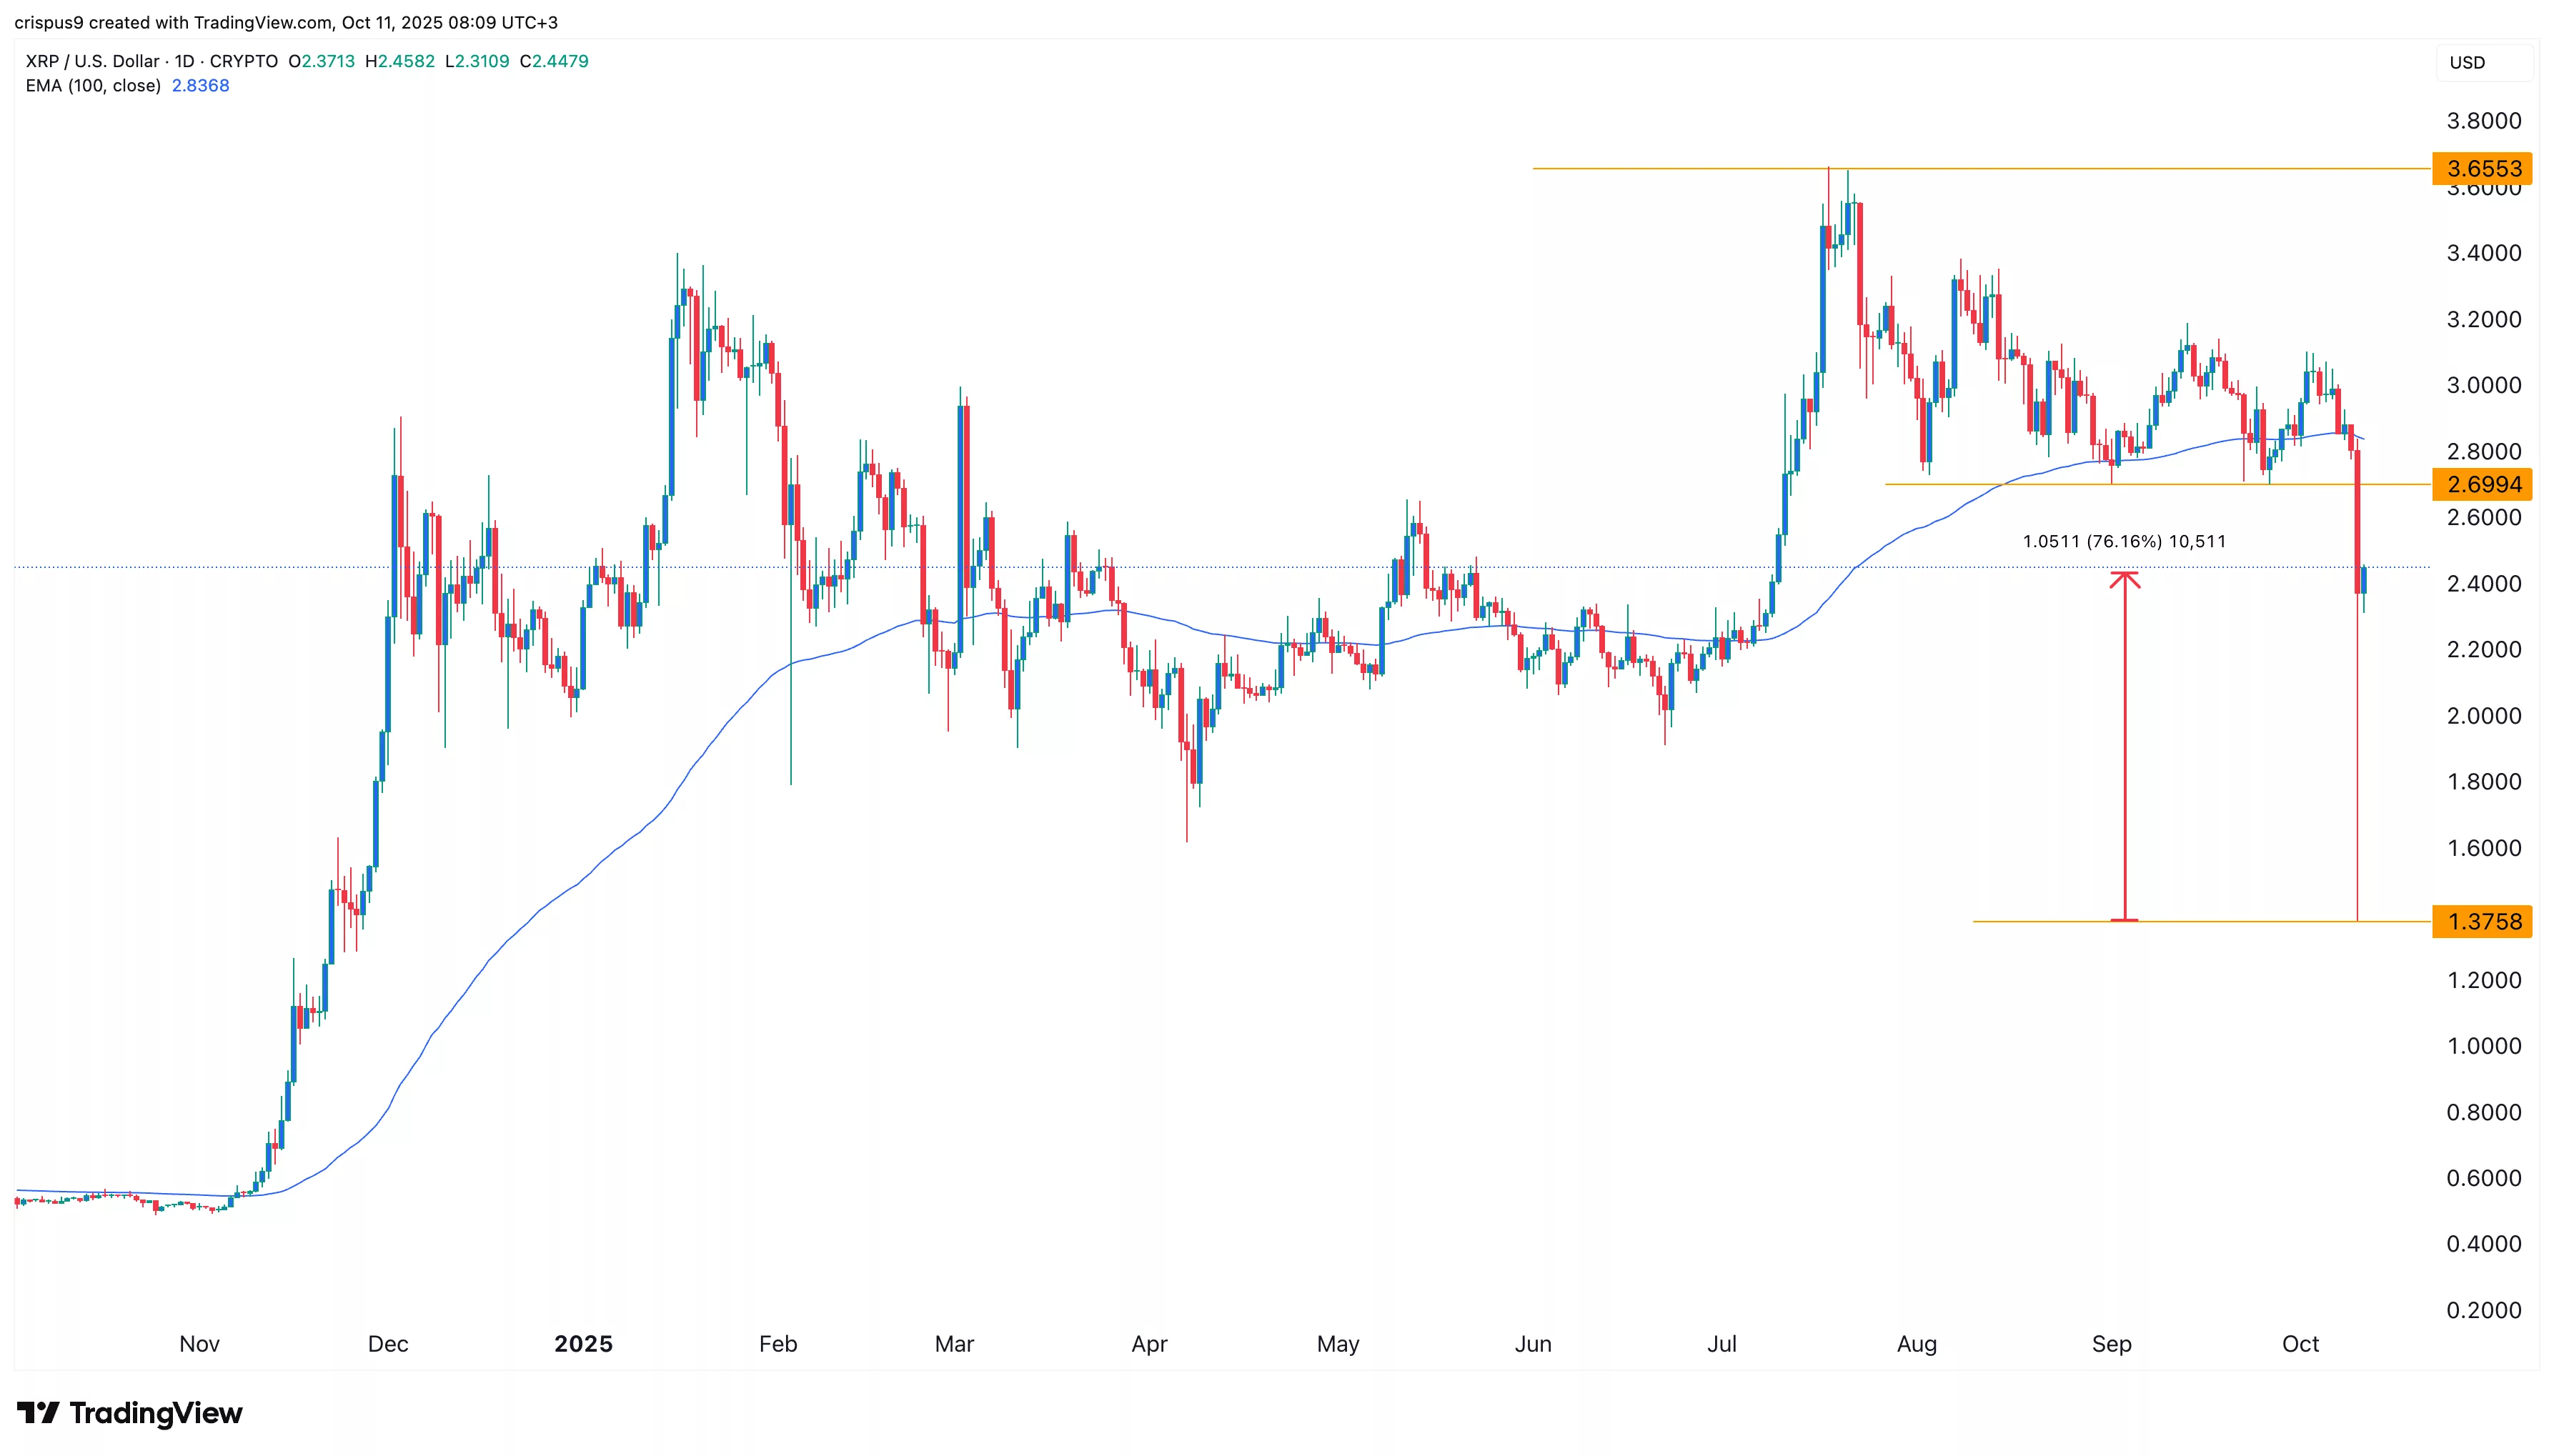
The daily chart shows that the XRP price peaked at $3.6553 in July and then plunged to a low of $1.3758 on Friday. This plunge occurred after the coin formed a descending triangle pattern, a standard bearish indicator.
The drop also invalidated other bullish patterns, such as the falling wedge, bullish flag, and cup-and-handle. It also slipped below the 50-day and 100-day Exponential Moving Averages.
On the positive side, the coin has formed a giant hammer candlestick pattern — one of the most common bullish reversal patterns in technical analysis.
Therefore, the most likely scenario is where the XRP price is volatile as the trade war escalates. It may rebound and retest the resistance at $2.70 and then resume the downtrend in the NEAR term.
