Ethereum Price Primed for Rebound as Spot ETH ETFs Notch 7 Consecutive Days of Inflows

Ethereum's recovery narrative gains serious momentum as institutional money floods back into digital asset markets.
The Institutional Stampede
Seven straight days of net inflows into spot Ethereum ETFs signal a dramatic shift in sentiment. Wall Street's sudden affection for ETH products suggests the smart money sees value at current levels—or they're just chasing the next shiny object after missing Bitcoin's run.
Technical Breakout Imminent
Price action consolidates near key support levels while the inflow data builds a compelling case for upward movement. The sustained institutional interest creates fundamental support that could propel ETH past recent resistance zones.
Market Structure Shifts
Traditional finance's embrace of Ethereum through regulated products continues reshaping the crypto landscape. The seven-day inflow streak represents the longest sustained institutional accumulation since ETF approvals—because nothing gets financiers excited like being late to a trend they previously mocked.
With momentum building and institutions finally putting real money behind their cautious optimism, Ethereum's path to recovery looks increasingly credible—or at least well-funded.
Spot ETH ETF inflows could drive momentum
Spot Ethereum ETFs are still drawing consistent inflows. SoSoValue data shows net inflows of $420 million on Oct. 7, the seventh day in a row of positive activity., The combined assets of the spot Ethereum ETFs now exceed $30 billion, with inflows totaling $803 million in the past month.
Despite short-term volatility, these inflows indicate that institutional confidence in Ethereum has remained strong. Constant demand for ETFs helps absorb circulating supply and mitigate negative movements. As institutional exposure increases, analysts predict that if the trend continues through October, it may help a medium-term price recovery.
With corporate treasuries and ETFs absorbing supply, exchange reserves have already dropped to a three-year low of 17.4 million ETH from 28.8 million in 2022. Public companies now hold around 3.6 million ETH, adding to the supply squeeze.
Additionally, the ongoing EIP-1559 burn mechanism, which permanently eliminates a portion of transaction fees, is making Ethereum’s supply dynamics more deflationary.
Ethereum price technical analysis
Ethereum’s daily chart shows a steady consolidation pattern within the Bollinger Bands, with a price o $4,450, just above the mid-band at $4,313, which is currently acting as short-term support. The upper band, which is NEAR $4,731, is the next resistance to watch.
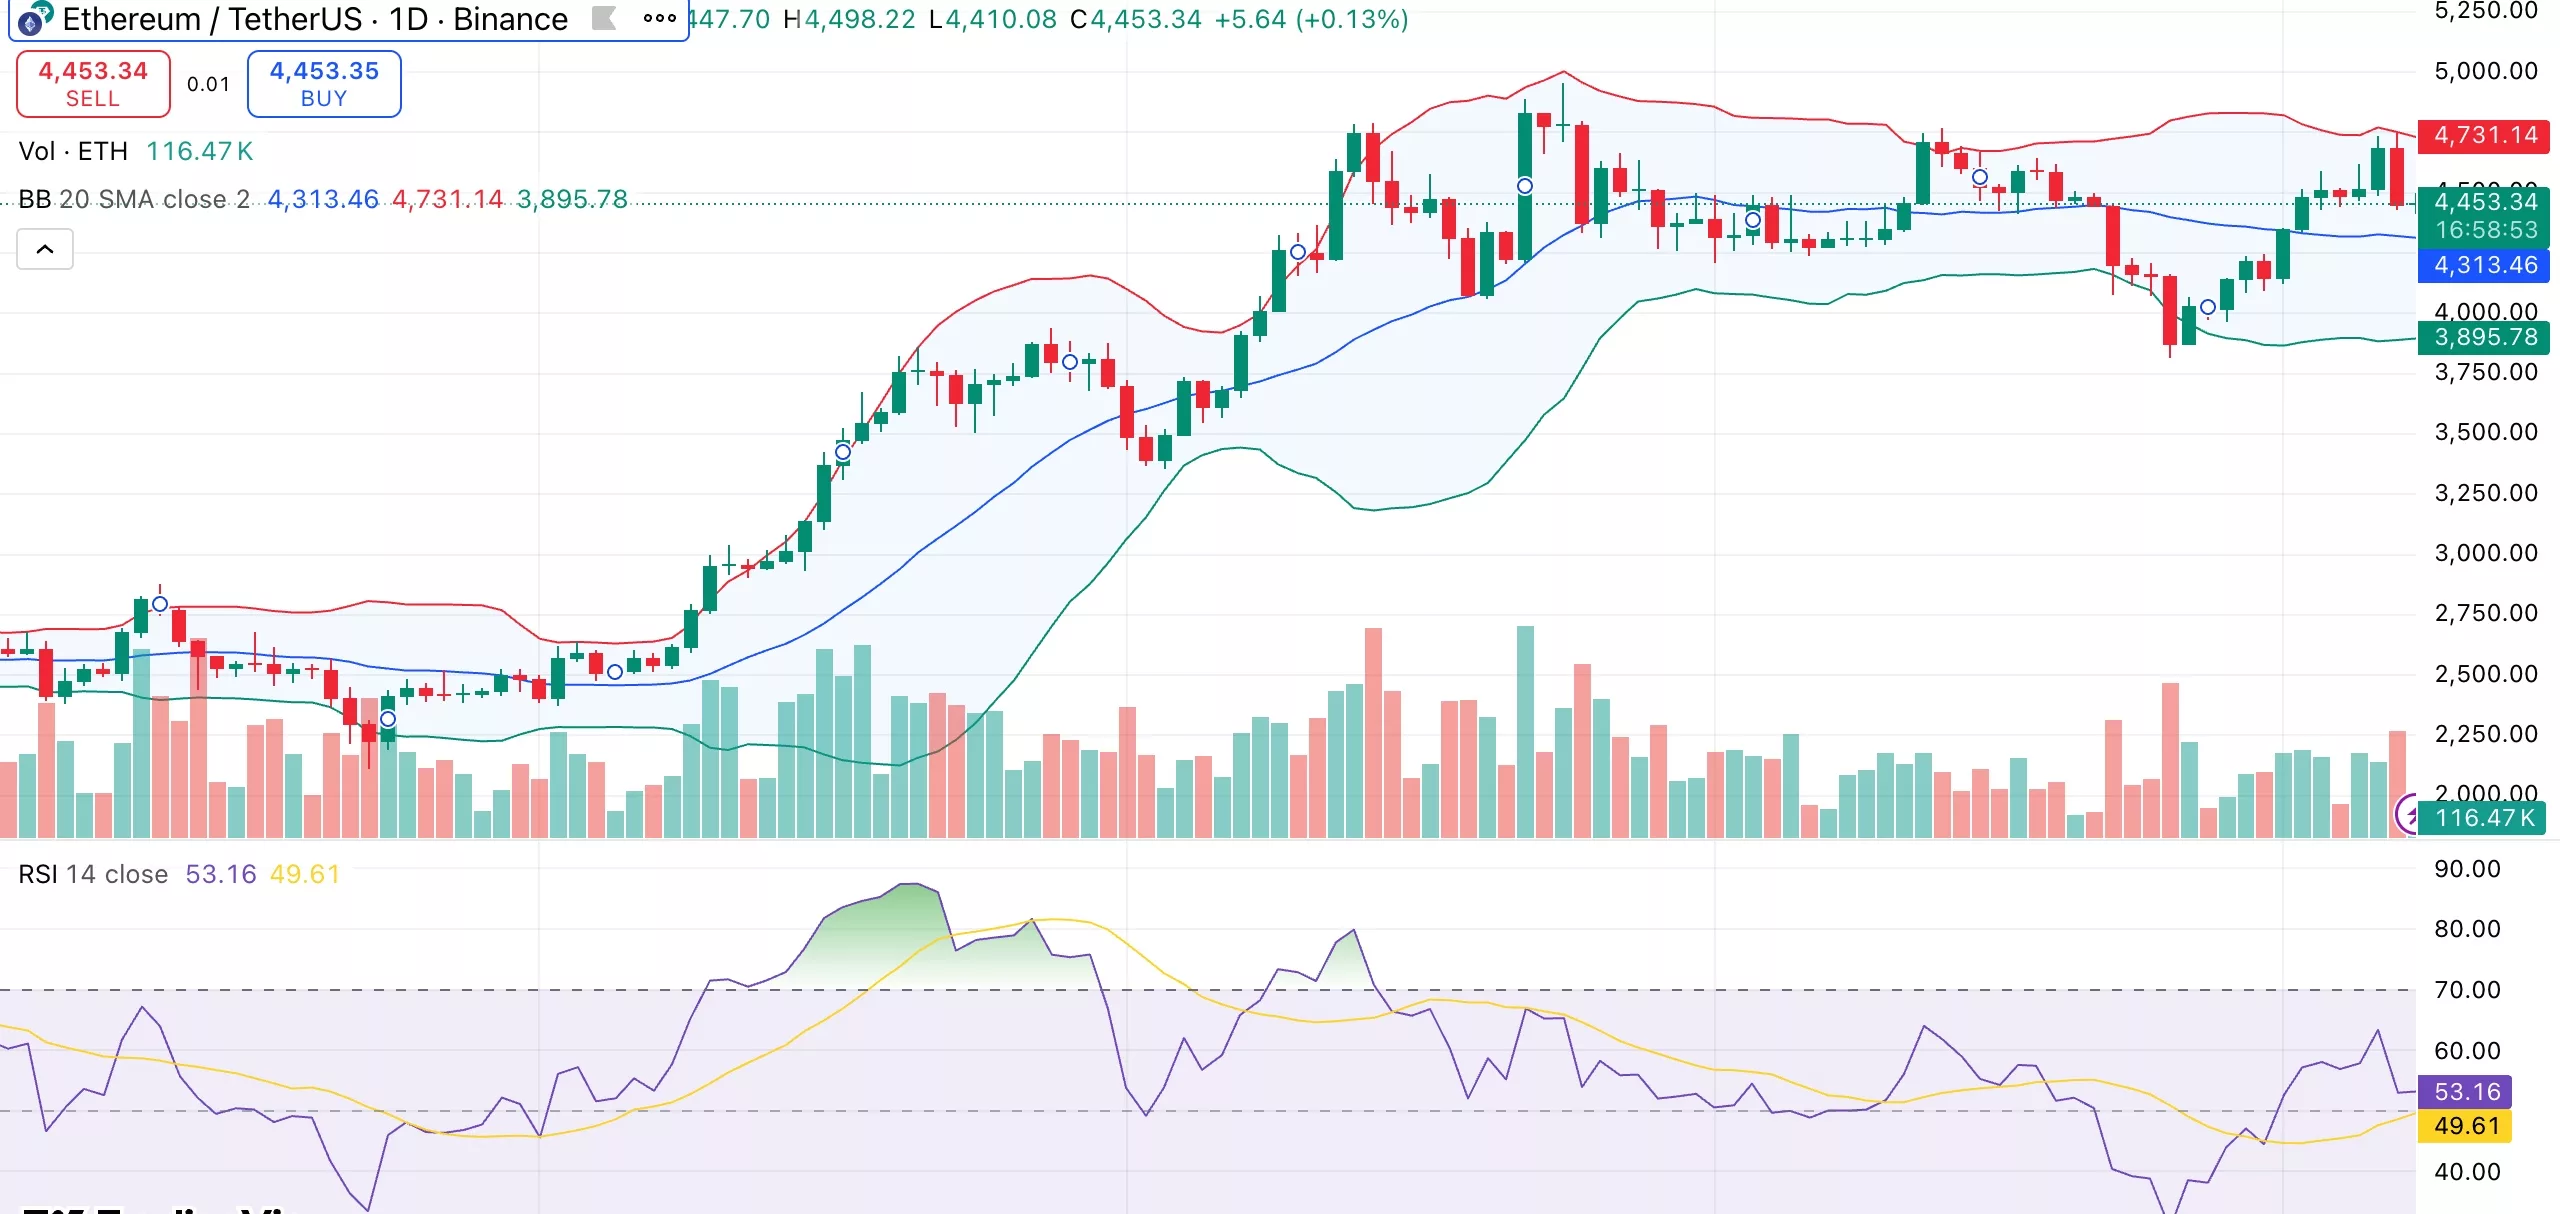
The fact that trading volumes are still strong indicates that ETH is stabilizing following recent volatility. At 53, the Relative Strength Index (RSI) indicates that the market is balanced and neither overbought nor oversold. Given this neutral momentum, Ethereum may be getting ready for its next significant MOVE once volatility contracts further.
If bulls can push above $4,700, ETH may swiftly retest the $4,900–$4,950 range, which WOULD correspond with the August high and suggest a possible continuation toward the psychological $5,000 level, In contrast, a close below $4,300 could lead to $3,900, the point at which the 50-day moving average and the lower Bollinger Band converge.
