Bitcoin’s On-Chain Signals Scream Upside: Whale Accumulation Hits Fever Pitch

Whales are gobbling up Bitcoin while on-chain metrics flash green—retail's about to miss the boat again.
The Accumulation Game
Deep-pocketed investors aren't just dipping toes—they're diving headfirst into Bitcoin positions. On-chain data reveals accumulation patterns that historically precede major price breakouts.
Technical Tailwinds
Network fundamentals strengthen as large holders refuse to sell at current levels. The smart money's betting against conventional wisdom—because nothing makes Wall Street analysts more uncomfortable than assets they can't rehypothecate.
While traditional finance debates inflation hedges, Bitcoin's building momentum where it matters: on the blockchain. The last time these signals aligned? Let's just say portfolio managers are still explaining their 'cautious approach' to clients.
On-chain picture remains constructive
Three important indicators influencing the current pullback are highlighted in a Sept. 23 analysis by XWIN Research Japan, a contributor to CryptoQuant.
First, the 30-day Market Value to Realized Value ratio has turned negative, meaning the average Bitcoin holder is now at a loss. Historically, such periods mark undervaluation zones and improve risk-adjusted entry points.
Second, whales continue to accumulate. Santiment data indicates that since Aug. 27, 56,372 BTC has been absorbed by wallets with balances holding between 1,000 to 10,000 BTC. This steady demand from large players helps stabilize price action despite retail volatility.
Third, exchange reserves have decreased by more than 31,000 BTC in the past month alone, continuing a long-term downward trend. Because there are fewer coins for sale, supply-side pressure is reducing, which creates a favorable environment for medium-term price movement.
Though sentiment remains cautious, undervaluation, accumulation, and a supply squeeze all indicate the start of a recovery phase.
Bitcoin price technical analysis
Bitcoin is consolidating following the recent decline from its peak in August, trading close to the middle of its Bollinger Band. Momentum indicators are mixed. With a relative strength index of 46, the market is neither overbought nor oversold.
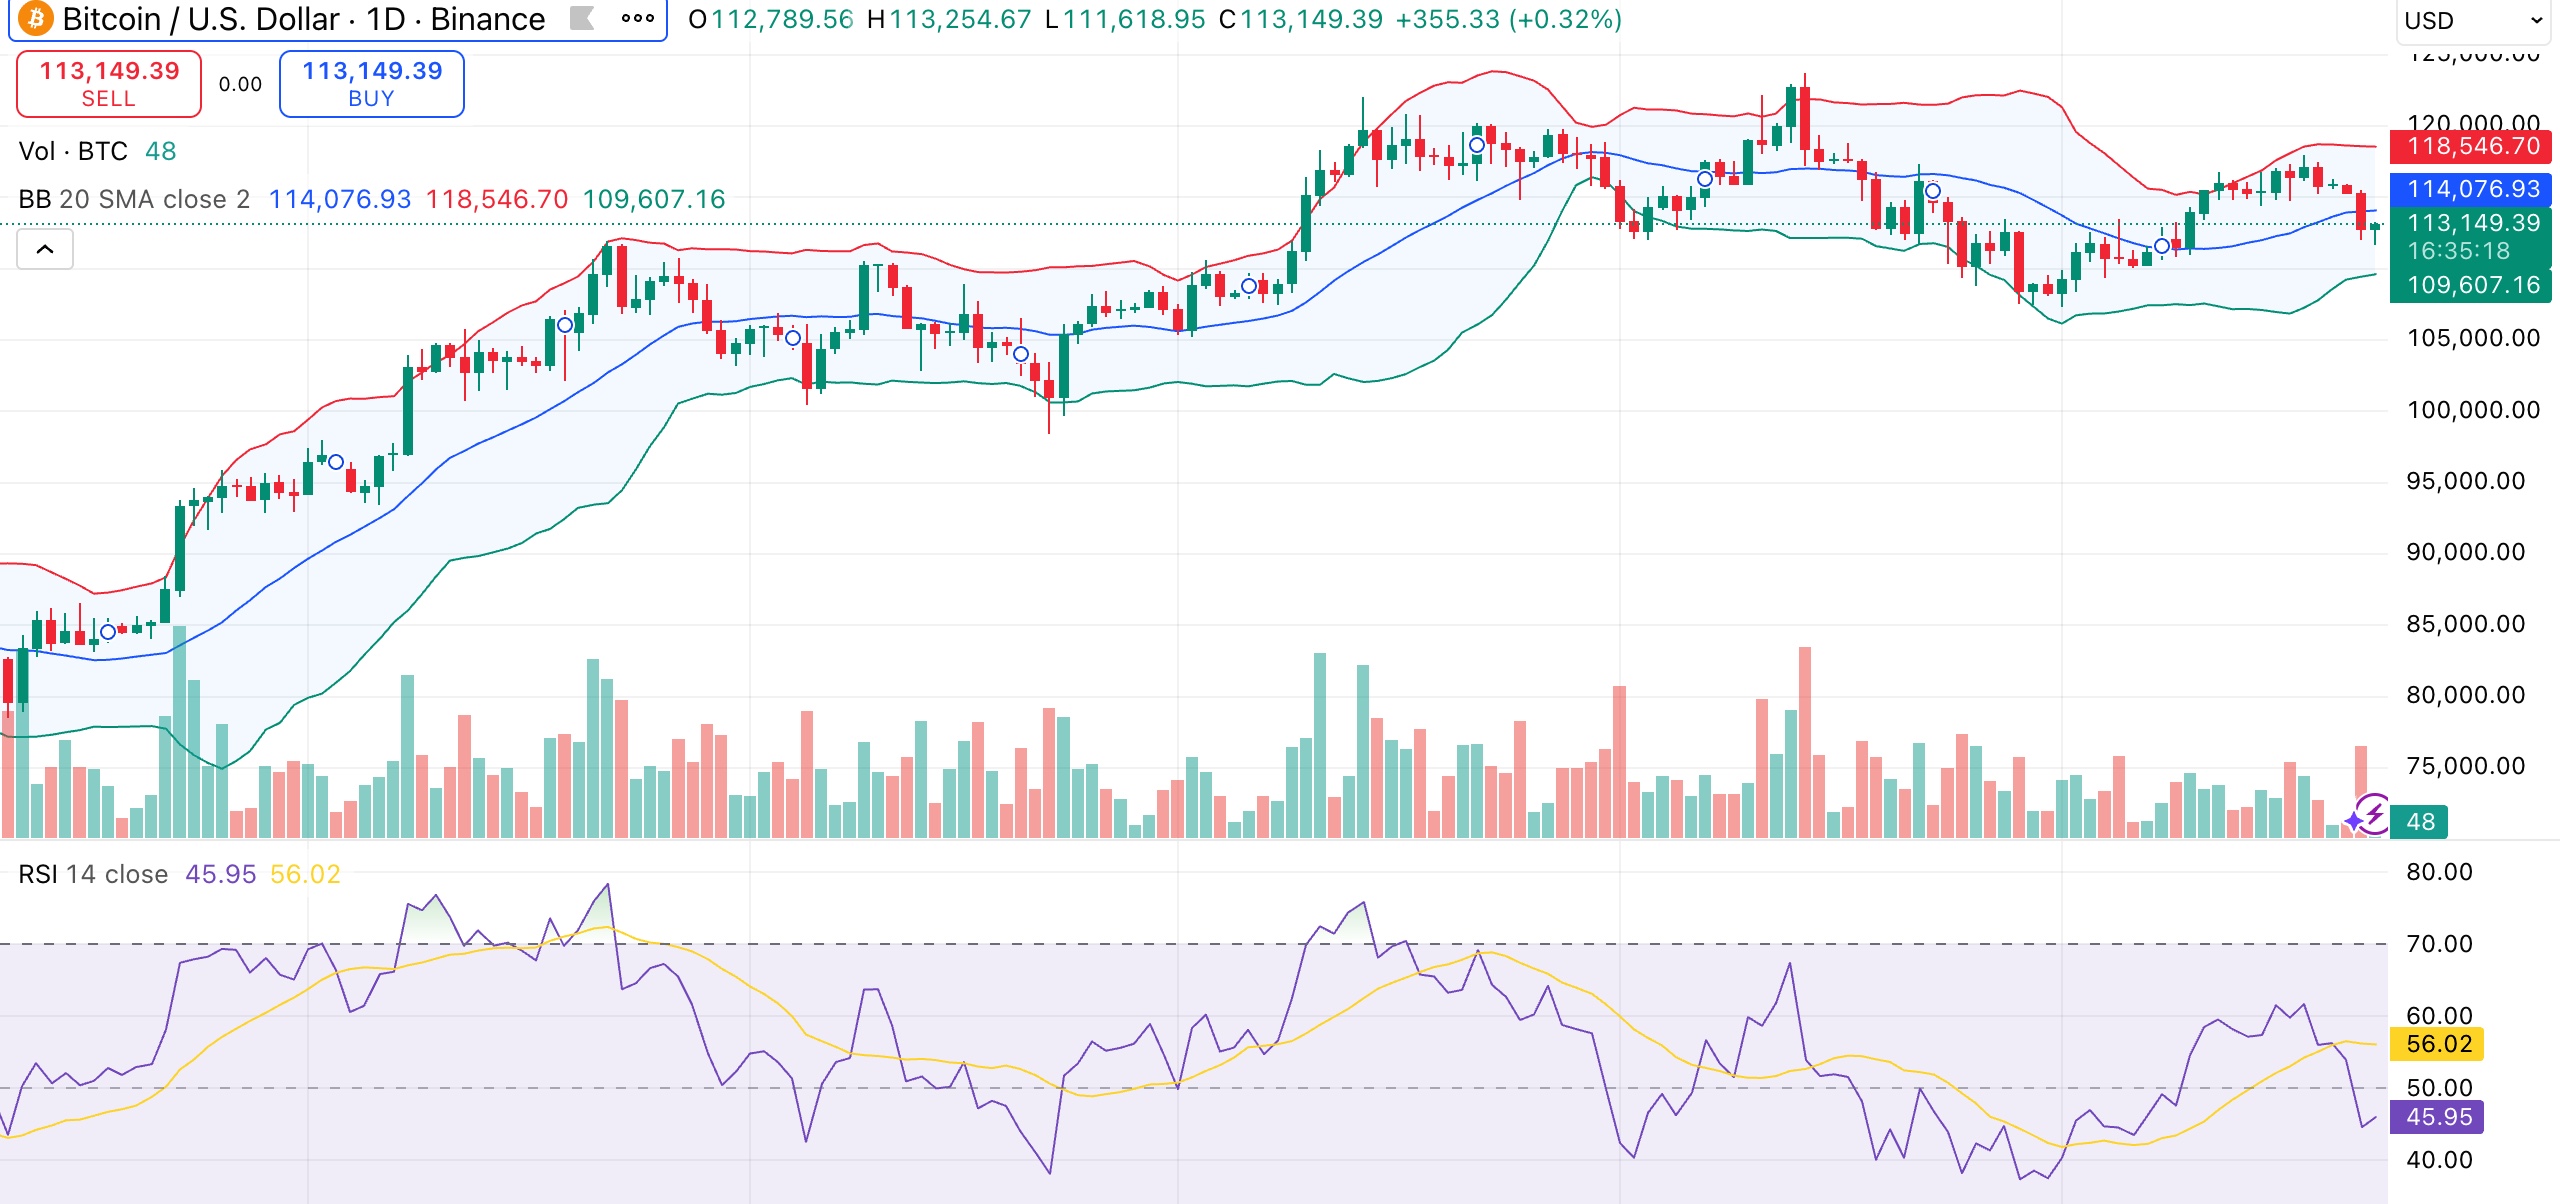
The momentum oscillator points to a possible rebound, but the MACD has turned bearish and is flashing a sell signal. Short-term moving averages are bearish, with the majority of 10- to 50-day averages flashing sell signals. However, the 200-day EMA at $106,063 is still supportive.
Key support lies at $112,000, followed by the 200-day EMA near $106,000. On the upside, resistance is clustered around $115,500–$118,500, where multiple moving averages converge. A break above that range WOULD open the path back toward $120,000.
Although the short-term outlook is cautious, on-chain accumulation and diminishing reserves indicate that the downside may be limited, and whales are subtly getting ready for the next leg higher.

Log in to Reply
Log in to comment your thoughtsComments
Related Articles
|Square
Get the BTCC app to start your crypto journey
Get started today Scan to join our 100M+ users