XRP Price: Bears Seize Control as Token Plunges Below Critical $3 Support Level - What’s Next for the Digital Asset?

XRP's foundation cracks as bears smash through the $3 barrier that traders watched like hawks. The digital asset tumbles while the market holds its breath.
Technical Breakdown: Support Becomes Resistance
The $3 level wasn't just another number—it represented a psychological battleground where bulls mounted their defense. Now that defense lies in ruins, creating a new ceiling that could haunt any recovery attempts.
Market Forces at Play
Whales dump positions while retail investors scramble. Trading volume spikes as panic sets in—classic capitulation signals that often precede either brutal declines or surprising reversals.
What's Next for XRP?
Watch the $2.50 level like your portfolio depends on it. Break that, and we're staring into the abyss. Hold it, and we might just see the dead cat bounce that crypto traders love to overhype.
Meanwhile, traditional finance analysts nod sagely about 'speculative bubbles' while ignoring their own 2008-sized skeletons in the closet. The irony's thicker than a banker's bonus.
XRP either finds its footing here or continues the descent. In crypto, the only certainty is volatility—and the occasional regulatory headache that makes this look organized.
TLDR
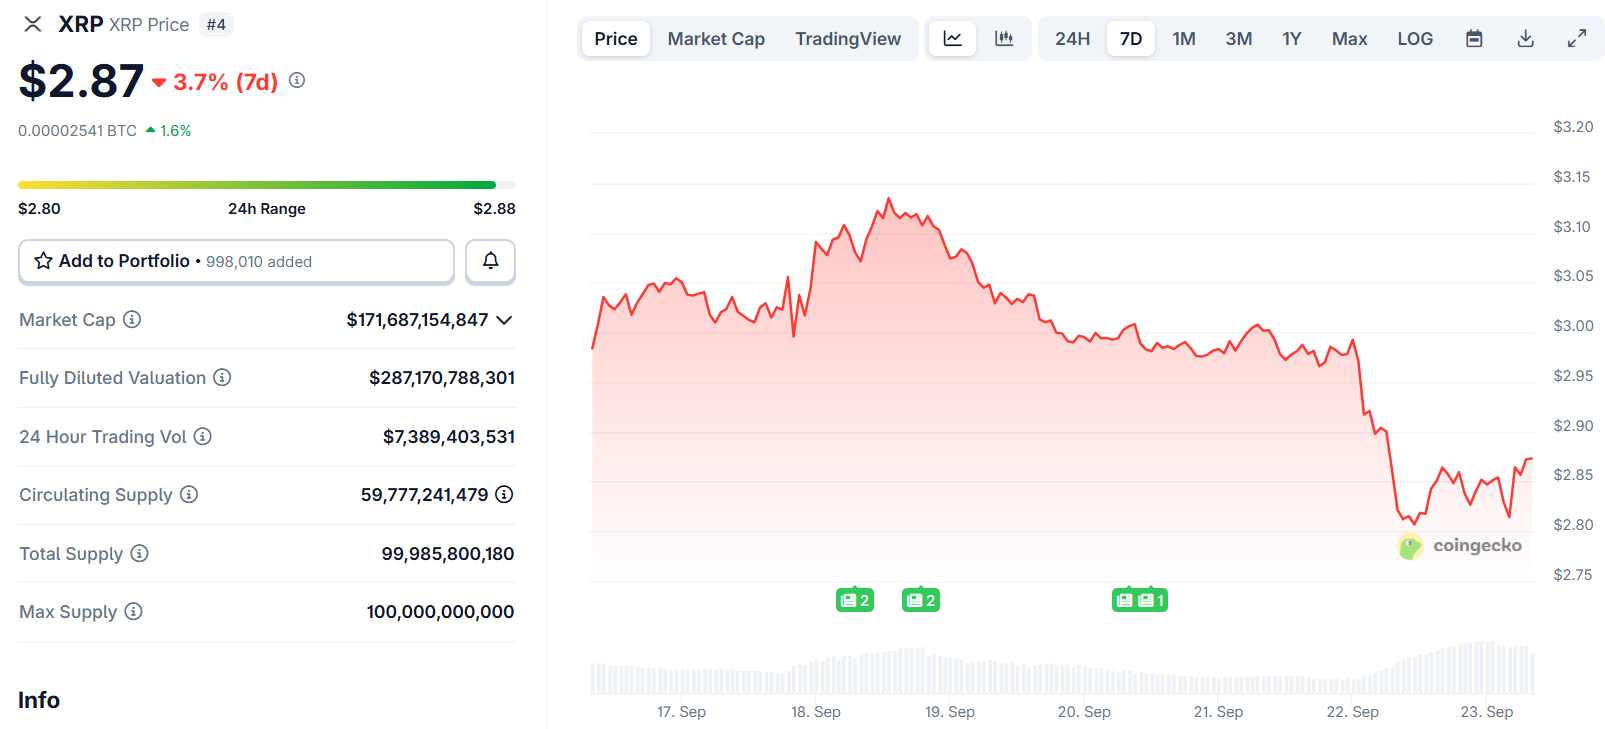
- XRP dropped 5% in 24 hours to trade around $2.80, failing to hold the $3 support level
- Technical analysis shows a descending triangle pattern with potential target near $2.07
- Price is trading below key moving averages with bearish momentum building
- Net Unrealized Profit/Loss indicator suggests possible local top at $3.18
- Despite short-term bearish signals, some analysts maintain bullish long-term outlook
XRP price faced downward pressure on Monday as the cryptocurrency failed to maintain support above the critical $3 level. The digital asset declined 5% over 24 hours to trade at approximately $2.80.
The recent price action represents a continuation of weakness that began after XRP failed to extend gains above $3.120. Bears pushed the price below multiple support levels including $3.00 and $2.920.
During the selloff, XRP reached a low NEAR $2.678 before staging a partial recovery. The cryptocurrency has since corrected some losses but remains below key technical levels.
Current trading activity shows XRP positioned below both the $2.90 level and the 100-hourly Simple Moving Average. A bearish trend line has formed with resistance at the $2.920 level.
Technical analysis reveals the formation of a descending triangle pattern on the daily chart. This bearish continuation pattern features a downward-sloping resistance line and horizontal support.
Key Resistance and Support Levels
If XRP breaks below the triangle’s support around $2.75, technical targets point toward $2.07. Such a move WOULD represent approximately 26% decline from current price levels.
The descending triangle’s target is calculated by measuring the pattern’s height and projecting it from the breakout point. This methodology provides traders with potential downside objectives.
XRP currently trades below both the 50-day and 100-day Simple Moving Averages, reinforcing the bearish technical picture. The Relative Strength Index has dropped from 50 to 39, indicating increasing downward momentum.
Support levels on the downside include $2.820 and $2.80. A break below $2.80 could open the path toward $2.740 and eventually $2.650.
The 200-day Simple Moving Average at $2.52 may provide technical support if the decline continues. This level could offer relief for buyers looking to establish positions.
Market Metrics Signal Caution
Net Unrealized Profit/Loss data shows concerning signals for XRP holders. The metric currently sits in the 0.5-0.6 zone, historically associated with local price tops.
With over 94% of XRP supply showing profits at current prices, increased selling pressure remains possible. Similar setups in 2017, 2021, and January 2025 preceded sharp corrections.
The NUPL indicator suggests that $3.18 may have marked a local peak for this rally cycle. Profit-taking activity has increased as the metric moved into elevated territory.

Hourly MACD indicators show momentum losing pace in bearish territory. The technical oscillator confirms the weakening price action across shorter timeframes.
Despite near-term weakness, some analysts maintain bullish longer-term perspectives. Weekly chart analysis suggests a bull flag pattern remains intact since November 2024.
#XRP price will be $5 by end of October! pic.twitter.com/EoFQNHG4YJ
— CryptoBull (@CryptoBull2020) September 22, 2025
The hourly RSI reading below 50 supports the bearish thesis for immediate price action. Technical momentum indicators align with the descending price structure.
On the upside, XRP faces resistance near $2.90 and $2.920 levels. A clear break above $2.920 could target the $3.00 resistance zone.
XRP trading activity shows bears maintaining control below the $2.920 resistance level, with the trend line providing additional selling pressure at this zone.
