Dogecoin Bulls Target $0.26 Breakout as Critical Triangle Pattern Nears Climax

Dogecoin's consolidation phase hits inflection point as technical setup suggests major move imminent.
Symmetrical triangle formation tightens—traders brace for volatility explosion.
Breaking $0.26 resistance would confirm bullish continuation pattern, potentially triggering 30%+ upside momentum.
Volume divergence hints at institutional accumulation—retail still chasing last cycle's memes while smart money positions.
Watch for decisive close above pattern boundary—anything less invites another trip to re-test support levels.
Because in crypto, triangles either launch rockets or trap bulls—no in-between.
TLDR
- Dogecoin trades at $0.22 within a symmetrical triangle pattern with breakout potential targeting $0.26 in two weeks
- Key resistance sits at $0.25 while support levels hold at $0.21 and $0.19
- Technical indicators show neutral RSI at 49.06 and compressed Bollinger Bands suggesting volatility expansion ahead
- Whale activity reveals mixed signals with 2 billion DOGE accumulated but $200 million in outflows recorded
- Trading volume of $186.7 million indicates healthy interest though higher volume needed to confirm any breakout
Dogecoin currently trades at $0.22 as the meme cryptocurrency approaches a critical technical juncture. The price action has formed a symmetrical triangle pattern that analysts believe could lead to a breakout within the next two weeks.
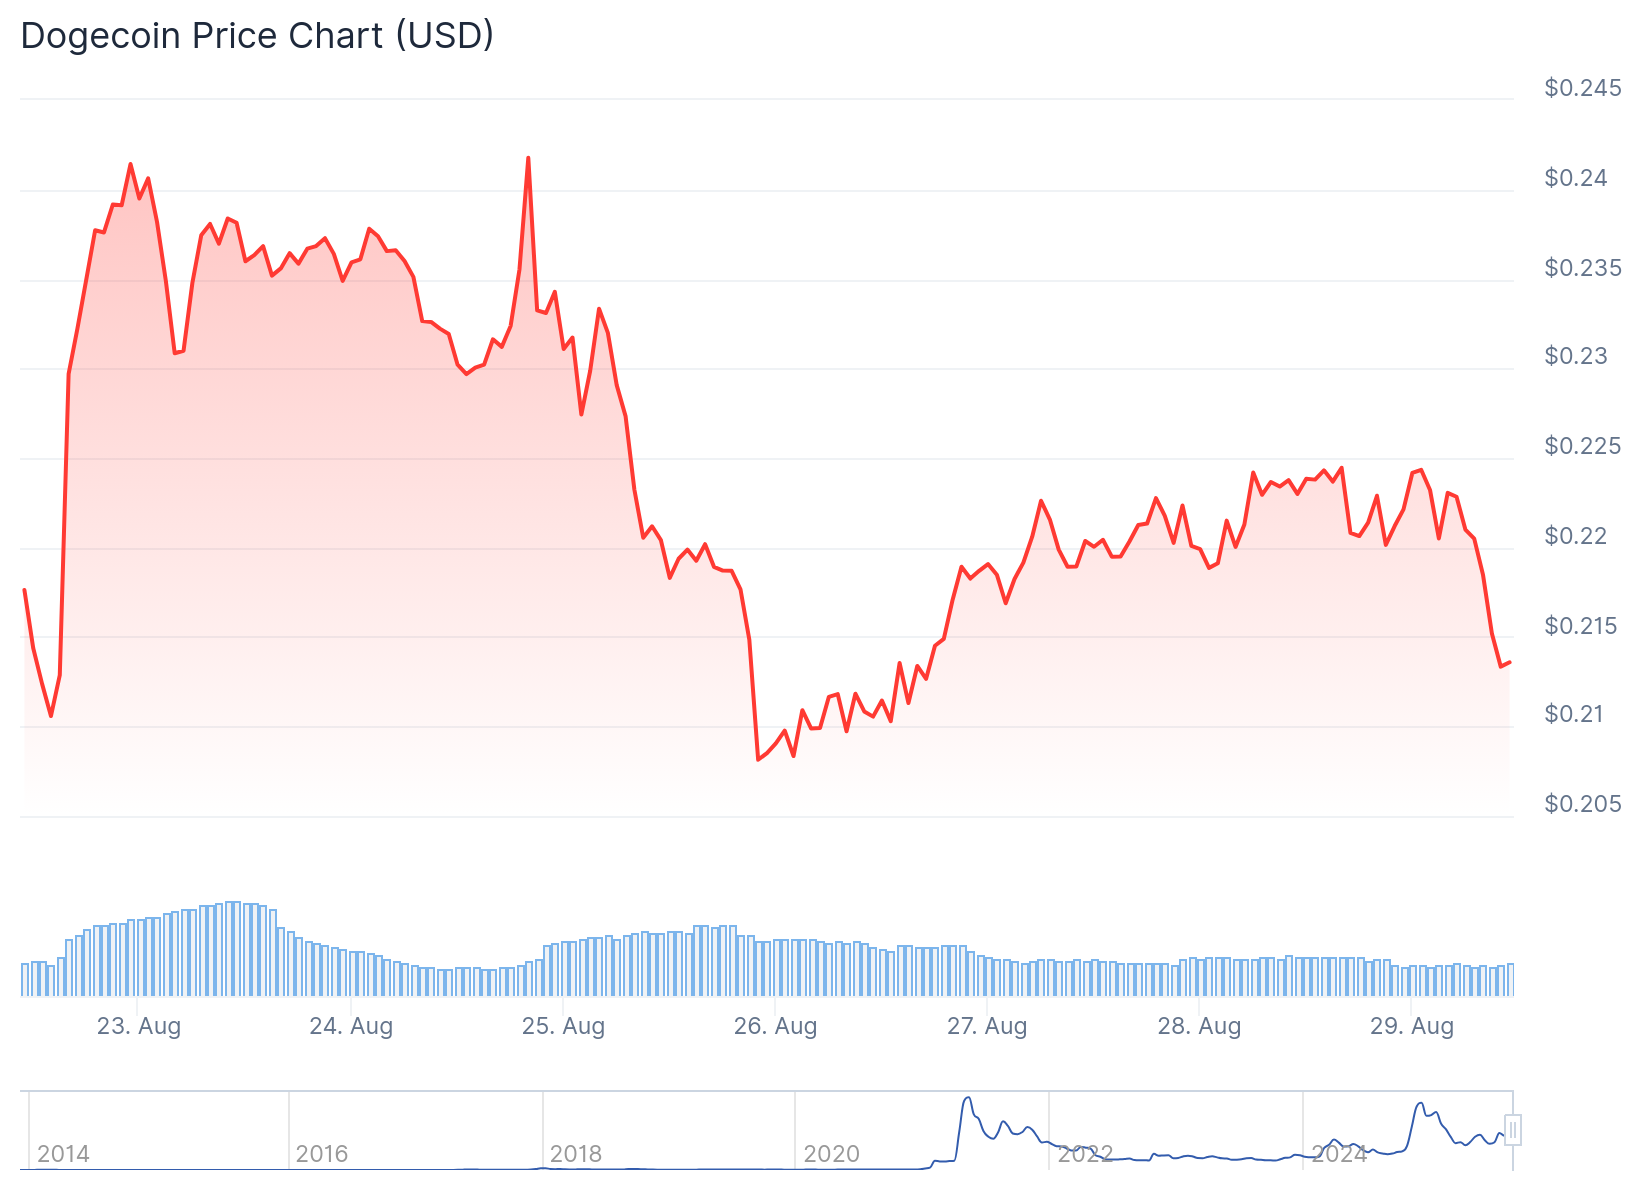
The symmetrical triangle shows converging trendlines that indicate consolidation. This pattern typically precedes strong directional moves. A breakout above the upper trendline could signal upward momentum.
Resistance levels between $0.20 and $0.25 represent crucial zones for price action. A sustained MOVE above $0.25 could trigger bullish sentiment and attract additional buyers.
Support levels sit at $0.19 to $0.21. If Dogecoin falls below $0.19, increased selling pressure may emerge. This could lead to a test of lower price levels.
The Relative Strength Index sits at 49.06 in neutral territory. This positioning provides room for bullish momentum without reaching overbought conditions.
Dogecoin Price Prediction
Bollinger Bands show Doge compressed between $0.21 and $0.25. This compression typically leads to volatility expansion. With the overall trend remaining intact, breakout probability may favor the upside.

The MACD histogram displays -0.0012 bearish momentum. However, this minor divergence often occurs before trend continuation moves. The MACD line at 0.0002 sits close to the signal line at 0.0014.
Trading volume on Binance reached $186.7 million, indicating healthy market interest. Analysts suggest volume needs to expand above $250 million to confirm any breakout attempt.
Cup-and-handle formations have also appeared on the charts. This classic bullish continuation pattern could confirm an uptrend if resistance breaks.
Ascending triangle patterns are visible as well. These formations often signal bullish continuation when breakouts occur above resistance levels.
Whale Activity and Market Dynamics
Large holders have accumulated over 2 billion DOGE tokens recently. This accumulation signals confidence in the asset’s long-term potential among major investors.
Conversely, outflows totaling $200 million have raised questions about selling pressure. This creates a tug-of-war between accumulation and distribution forces.
Whale movements can impact market sentiment and price direction. Monitoring these activities remains essential for understanding potential price moves.
The Money FLOW Index indicates increased buying activity. However, a sudden shift in this indicator could lead to sharp corrections in either direction.
Multiple analysts project similar price targets around $0.23 to $0.31. This consensus suggests strong technical confluence at these levels.
The Price Forecast Bot’s AI-driven model targets $0.227, validating algorithmic analysis approaches. Bitcoinist provides the most aggressive forecast at $0.31 for the symmetrical triangle breakout.
Retail sentiment currently appears overbought with crowded long positions. This increases the risk of sharp corrections if breakouts fail to materialize.
The timeline for potential moves spans 10-14 trading days. The critical juncture occurs at the triangle apex around September 5-8.
Daily Average True Range of $0.02 suggests normal volatility levels. This supports measured target approaches rather than extreme price projections.
Network metrics remain stable with steady hash rates indicating robust security. Low stress levels suggest efficient network operations without bottlenecks.
Confidence levels for the bullish scenario stand at medium (65%) based on pattern validity and analyst consensus.
