Dogecoin (DOGE) Price Alert: Three Bullish Patterns Signal Imminent Breakout as Traders Position for Surge

Dogecoin's chart just flashed its most compelling bullish setup in months—and traders are taking notice.
Triple Pattern Convergence
Three distinct technical formations are aligning simultaneously: a descending wedge breakout, bullish divergence on momentum indicators, and a classic cup-and-handle formation completing on higher timeframes. This rare trifecta hasn't appeared since DOGE's last major rally cycle.
Volume Tells the Real Story
Spot volumes surged 40% as derivatives open interest hit monthly highs—traders are betting real money, not just meme-hyping this time. The whale accumulation pattern suggests institutional players are building positions quietly while retail remains distracted by newer shiny objects.
Breaking Through Resistance
Key resistance at $0.15 held through three previous tests, but the fourth attempt shows fundamentally different volume characteristics. Market makers appear to be stepping aside rather than defending this level—often the precursor to explosive moves.
Because nothing says 'sound investment thesis' like a cryptocurrency originally created as a joke now being analyzed with the same technical rigor as blue-chip stocks. Sometimes the market's irony writes its own punchlines.
TLDR
- Dogecoin trades near $0.21 support after failing to hold above $0.24, down 3% in 24 hours
- Analysts identify triangle, cup-and-handle, and rounding bottom patterns suggesting potential breakout
- Key resistance sits at $0.29 with support between $0.19-$0.20 according to technical analysis
- RSI shows improving momentum while MACD remains bearish in short term
- Network metrics like hash rate continue climbing, indicating miner confidence
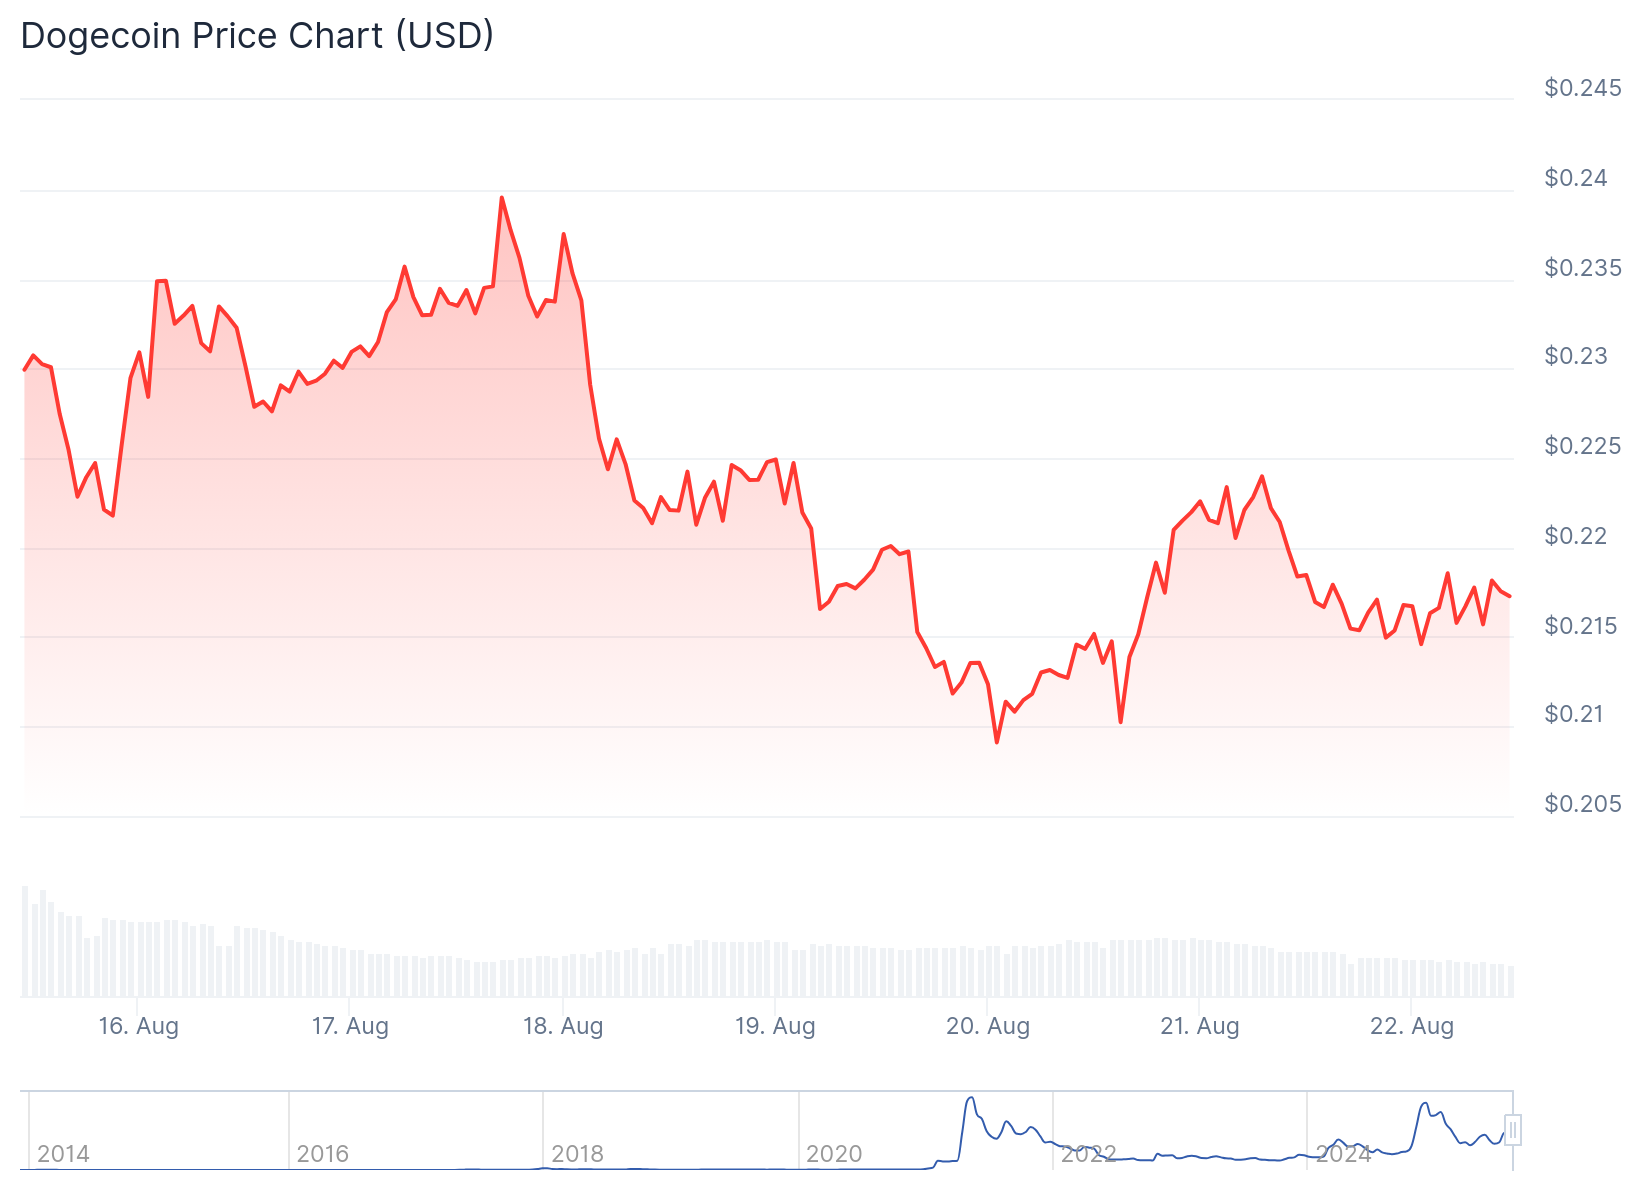
Dogecoin price faces a critical test at the $0.21 support level as traders watch for signs of a potential breakout. The meme coin has dropped nearly 3% in the past 24 hours and trades around $0.2152.
The token struggled to maintain levels above $0.24 and has been making lower highs and lows in recent sessions. This weakness comes as multiple analysts identify bullish chart patterns that could signal a reversal.
Analyst Zeinab highlighted that Doge has formed a rounding bottom pattern on recent charts. This formation typically develops before new uptrends begin.
$DOGE is showing a pattern similar to 2024. It’s forming a rounding bottom & if it breaks $0.29, it could rally like last time from $0.18 to $0.49.
A converging triangle is also forming, which means a breakout might be coming.
If the pattern repeats, we could reach $0.80 in Q4. pic.twitter.com/ZhUQ8LRyGf
— crypto Zeinab (@CryptoZeinab) August 20, 2025
She also noted the token is moving within a converging triangle. Triangle patterns often signal falling volatility before a breakout occurs.
The next major resistance level sits NEAR $0.29 according to her analysis. A clear move above that zone could resemble an earlier climb when the token advanced from around $0.18 to $0.49.
If momentum extends further, she said DOGE could target near $0.80 by the final quarter of 2025. Traders are monitoring the $0.29 level closely as it acts as the primary ceiling for the current trend.
Technical Indicators Point Both Directions
Short-term momentum indicators show mixed signals for Dogecoin. The Relative Strength Index sits at 47.33, slightly below the neutral 50 mark.
A lot of crypto setting up similarly here.
Take $DOGE for example.
Highs swept.
Lows swept.
Now decent 4HR volume and potential to see RSI cross bullish from near oversold levels.
This offers a nice 6.5 R/R ST trade set up.
NB I am not taking this trade, I'm already in a… https://t.co/rlYFrVopqJ pic.twitter.com/eByVjZIKo6
— Cryptoinsightuk (@Cryptoinsightuk) August 20, 2025
RSI has turned upward after reaching oversold territory earlier. Values below 30 indicate oversold conditions while readings above 70 show overbought levels.
The momentum gauge is approaching the midpoint, which signals improving conditions. Analyst Cryptoinsightuk said this aligns with potential for price recovery.
However, the MACD remains bearish with the MACD line at -0.00203 below the signal line. The histogram bars are turning red, indicating building momentum against buyers.
Bollinger Bands are widening around current price action. The upper band sits at $0.2499 while the middle band at $0.2211 has become resistance.
The lower band at $0.1924 represents the next downside target if current support fails to hold.
Network Strength Remains Solid
Analyst Alphractal emphasized that Dogecoin’s network fundamentals stay strong despite price weakness. The Network Stress Index shows stability in fees, hash rate, and supply dynamics.
Hash rate continues climbing, which indicates growing miner confidence. This metric measures the computational power securing the blockchain network.
Dogecoin Price Prediction
Multiple analysts agree on key price levels for Dogecoin. Support sits between $0.19 and $0.20 as the critical floor.
If the token holds this area, resistance targets appear near $0.38 according to some models. A break below $0.21 could push prices toward $0.1924 or even $0.1800.
Analyst Andrew Griffiths identified a cup-and-handle formation on the charts. This pattern appears as a rounded base followed by a smaller pullback.
#DOGE Analysis indicates a potential cup and handle formation, which may drive the price past $0.30, possibly reaching the channel's peak. Stay tuned for developments! 💚 #DOGEUSD For signals, use https://t.co/Gg38wPHMeL. DM me to JOIN. pic.twitter.com/clN6DB8QL3
— Andrew Griffiths (@AndrewGriUK) August 20, 2025
He said a confirmed MOVE above $0.30 could push DOGE toward the upper channel boundary. The cup-and-handle often precedes breakouts when confirmed.
Cryptoinsightuk calculated a risk-to-reward ratio of 6.5 for current setups. Ratios above 1 suggest potential returns outweigh risks.
Volume analysis supports the technical thesis according to several observers. Steady buying interest has appeared in recent weeks, though liquidity remains below previous rally levels.
Current Market Position
Dogecoin has declined 4.4% over the past week and about 17% over the past month. The all-time high stands at $0.7375.
Market capitalization sits around $33 billion with trading volume close to $3.4 billion. The token swept both recent highs and lows, clearing stop orders on both sides.
Valuation models like CVDD suggest the token could reach $0.54 based on current network activity. This model tracks dormant coin movements and has worked for other cryptocurrencies like Bitcoin and Litecoin.
The alignment of multiple technical patterns has led analysts to monitor DOGE closely. Momentum indicators and volume will determine whether the token can advance toward higher levels in the final quarter of 2025.
