Ethereum (ETH) Price Alert: $3,900 Retest Could Fuel Explosive Rally to $8,000 – Here’s What Analysts Say

Ethereum bulls are eyeing a make-or-break moment as ETH flirts with a critical retest at $3,900. If momentum holds, traders whisper about a moonshot toward $8,000—but don’t dust off your Lambo shopping list just yet.
The Setup: After months of sideways action, Ethereum’s chart is printing the kind of pattern that gets technical analysts sweating into their price charts. A clean breakout above $3,900 could open the floodgates.
The Skeptic’s Corner: Meanwhile, Wall Street ‘experts’ still can’t decide if crypto is the future or a Ponzi scheme—but hey, at least they’re consistent (in being late to the party).
Bottom Line: Whether this is the start of ETH’s next leg up or just another fakeout, one thing’s certain: the markets never get boring. Buckle up.
TLDR
- Ethereum (ETH) retreated to $4,280 after touching $4,776, just short of its $4,878 all-time high from 2021
- Record ETF inflows of 649,000 ETH highlight strong institutional demand despite the pullback
- Technical analysis suggests a potential retest of $3,900 support before a possible rally to $8,000
- Futures market shows overheating signals with retail participation entering “Too Many Retail” zones
- Flat funding rates around zero indicate spot buying rather than excessive leverage drove the recent rally
Ethereum has pulled back from recent highs after approaching its all-time high last week. The second-largest cryptocurrency briefly reached $4,776 before retreating to current levels around $4,280.
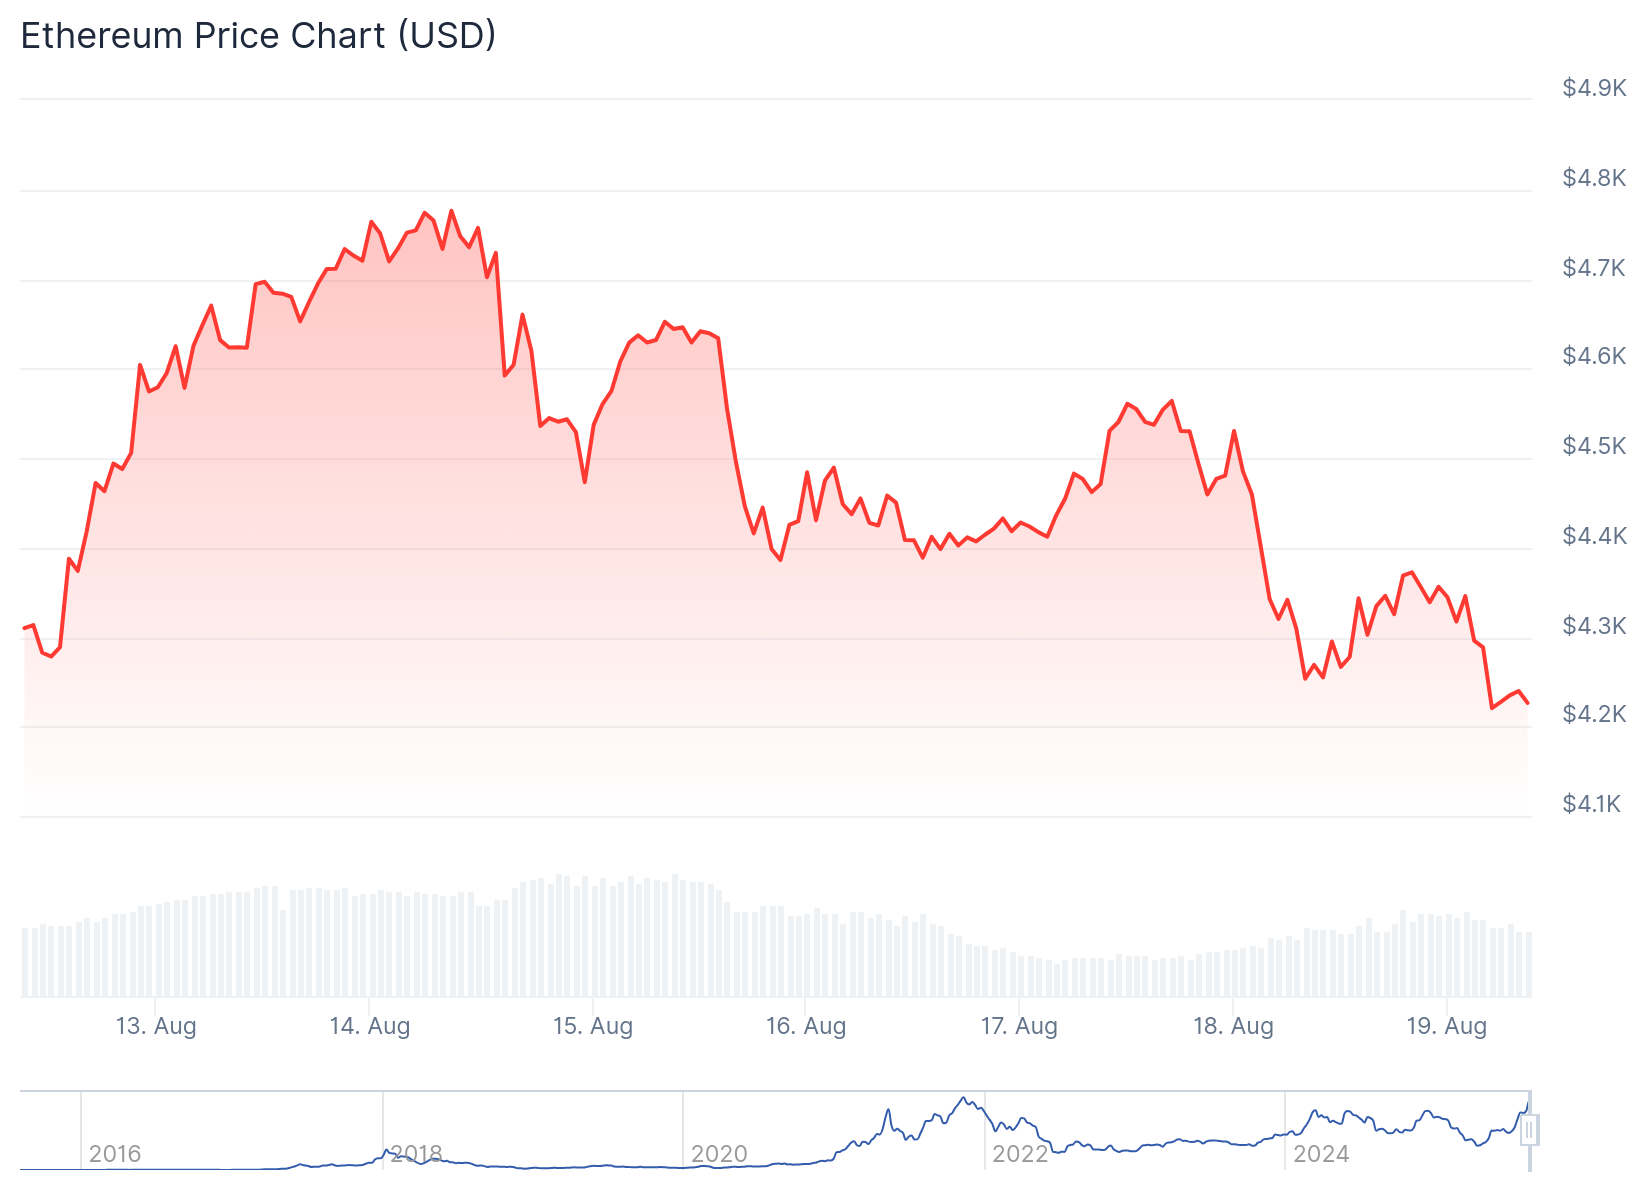
This represents a decline of nearly $500 from the peak. The recent high came close to Ethereum’s record of $4,878 set in 2021.
The pullback reflects a 5.7% decline over the past 24 hours. Trading activity currently places ETH between critical liquidity zones at $3,900 and $4,400.
ETF Inflows Drive Institutional Interest
Despite the recent correction, institutional demand remains strong through exchange-traded funds. US-listed spot Ether ETFs recorded nearly 649,000 ETH in net inflows last week.
Last week, $ETH spot ETFs recorded ~649K ETH in net inflows, the strongest on record, as price closed NEAR $4.5K. After touching $4.74K and pulling back over the weekend, today’s flows will show if institutions continue buying the dip or lock in profits. pic.twitter.com/OB6V8Ria0a
— glassnode (@glassnode) August 18, 2025
This marks the largest weekly inflow on record for these investment products. The inflows occurred even as ETH’s price consolidated between key levels.
Bloomberg analyst Eric Balchunas noted the performance of Ether ETFs. He described them as making Bitcoin the “second best” crypto asset in July.
The ETF category received recognition as ETF of the Month due to unprecedented investor interest. This institutional backing provides support for Ethereum’s longer-term outlook.
Ethereum Price Prediction
Chart analysis reveals several important price zones for Ethereum. The $4,150 level serves as immediate support, reinforced by multiple liquidity lows.
Below that sits a fair value gap around $4,000. This aligns with the 0.50-0.618 Fibonacci retracement range between $4,100 and $3,900.
ETHEREUM’S SLEEPER SETUP IS ALIVE.
Massive bullish pennant stretching across years of consolidation.
Smart money absorbed every dip.
Weak hands got flushed.
The breakout won’t stop at $8K.
It’s the start of a new chapter in $ETH history. pic.twitter.com/BhqXM6EbjZ
— Merlijn The Trader (@MerlijnTrader) August 18, 2025
Trading platform Kiyotaka identifies this zone as having a “giant cluster of resting bids stacked all the way down to $3.9K.” This makes it a critical range for potential reversals.
On the upside, ethereum faces resistance near $4,400. A break above this level could lead to a test of $4,583.
The four-hour relative strength index remains below 50. This suggests room for further downside before entering oversold territory.
Some analysts view a retest near $3,900 as constructive. This could flush out early long positions and provide liquidity for a stronger recovery.
Longer-term projections envision a pullback toward $3,000-$3,500. From there, analysts see potential for a rally past $8,000.
Futures Market Shows Overheating Signs
CryptoQuant analyst CryptoOnchain notes increased retail participation in Ethereum’s futures market. Trading frequency has entered “Many Retail” and “Too Many Retail” zones.
These levels historically appear near the late stages of strong uptrends. Retail participation surged as ETH prices moved above $4,500.
The analyst highlighted Ethereum’s Futures Volume Bubble Map. This currently shows clusters of large red bubbles near recent price highs.

Such patterns have frequently preceded either sharp breakouts or rapid corrections. Open interest on Binance futures climbed to nearly $12 billion before easing to around $10.3 billion.
The recent dip in open interest suggests some traders are reducing exposure. Binance’s taker buy/sell ratio has remained below 1, indicating selling pressure has dominated recent trading.
However, funding rates for ETH perpetual futures remain flat around zero. This contrasts with previous bull runs when funding rates spiked above 0.05-0.10.
CryptoQuant contributor Woominkyu explains this indicates the rally was driven more by spot buying rather than leverage. This creates a healthier market environment with reduced liquidation risk.
Current funding rates sitting flat suggest less overheated conditions compared to past rallies.
