Dogecoin (DOGE) Primed for August Surge as Golden Cross Emerges—Meme Magic or Market Mechanics?

Dogecoin’s charts just flashed a bullish signal that even Wall Street can’t ignore. The 50-day moving average sliced through the 200-day like a hot knife through butter—classic golden cross formation. Cue the crypto bros dusting off their 'To the Moon!' memes.
Why This Matters
Historically, this technical pattern precedes rallies—whether DOGE follows suit depends on whether traders still believe in the dog with diamond paws. No guarantees, but the setup’s cleaner than a Bitcoin maximalist’s spreadsheet.
Risks Ahead
Remember: this is the asset that turned 'because Elon tweeted' into an investment thesis. If the golden cross fails, the dip might hit harder than a rug pull on a no-name DeFi project.
Bottom line: Dogecoin’s got narrative and now, charts. Whether that translates to gains? Well, hope you like volatility with your memes.
TLDR
- Dogecoin price dropped 30% from its July peak of $0.28 to test crucial $0.19 support level
- Golden cross formation in late July maintains bullish long-term outlook despite recent decline
- RSI cooled from overheated 80+ reading to below 50, while MACD turned bearish showing momentum loss
- Major exchanges Binance and OKX show 3:1 and 3.6:1 long-to-short ratios indicating trader optimism
- Macroeconomic pressures from new trade policies and Fed rate decisions created headwinds for crypto markets
Dogecoin price has retreated from its recent highs as momentum indicators reset and macroeconomic factors weigh on risk assets. The meme coin reached a five-month high NEAR $0.28 on July 21 before declining approximately 30% to current levels around $0.19.
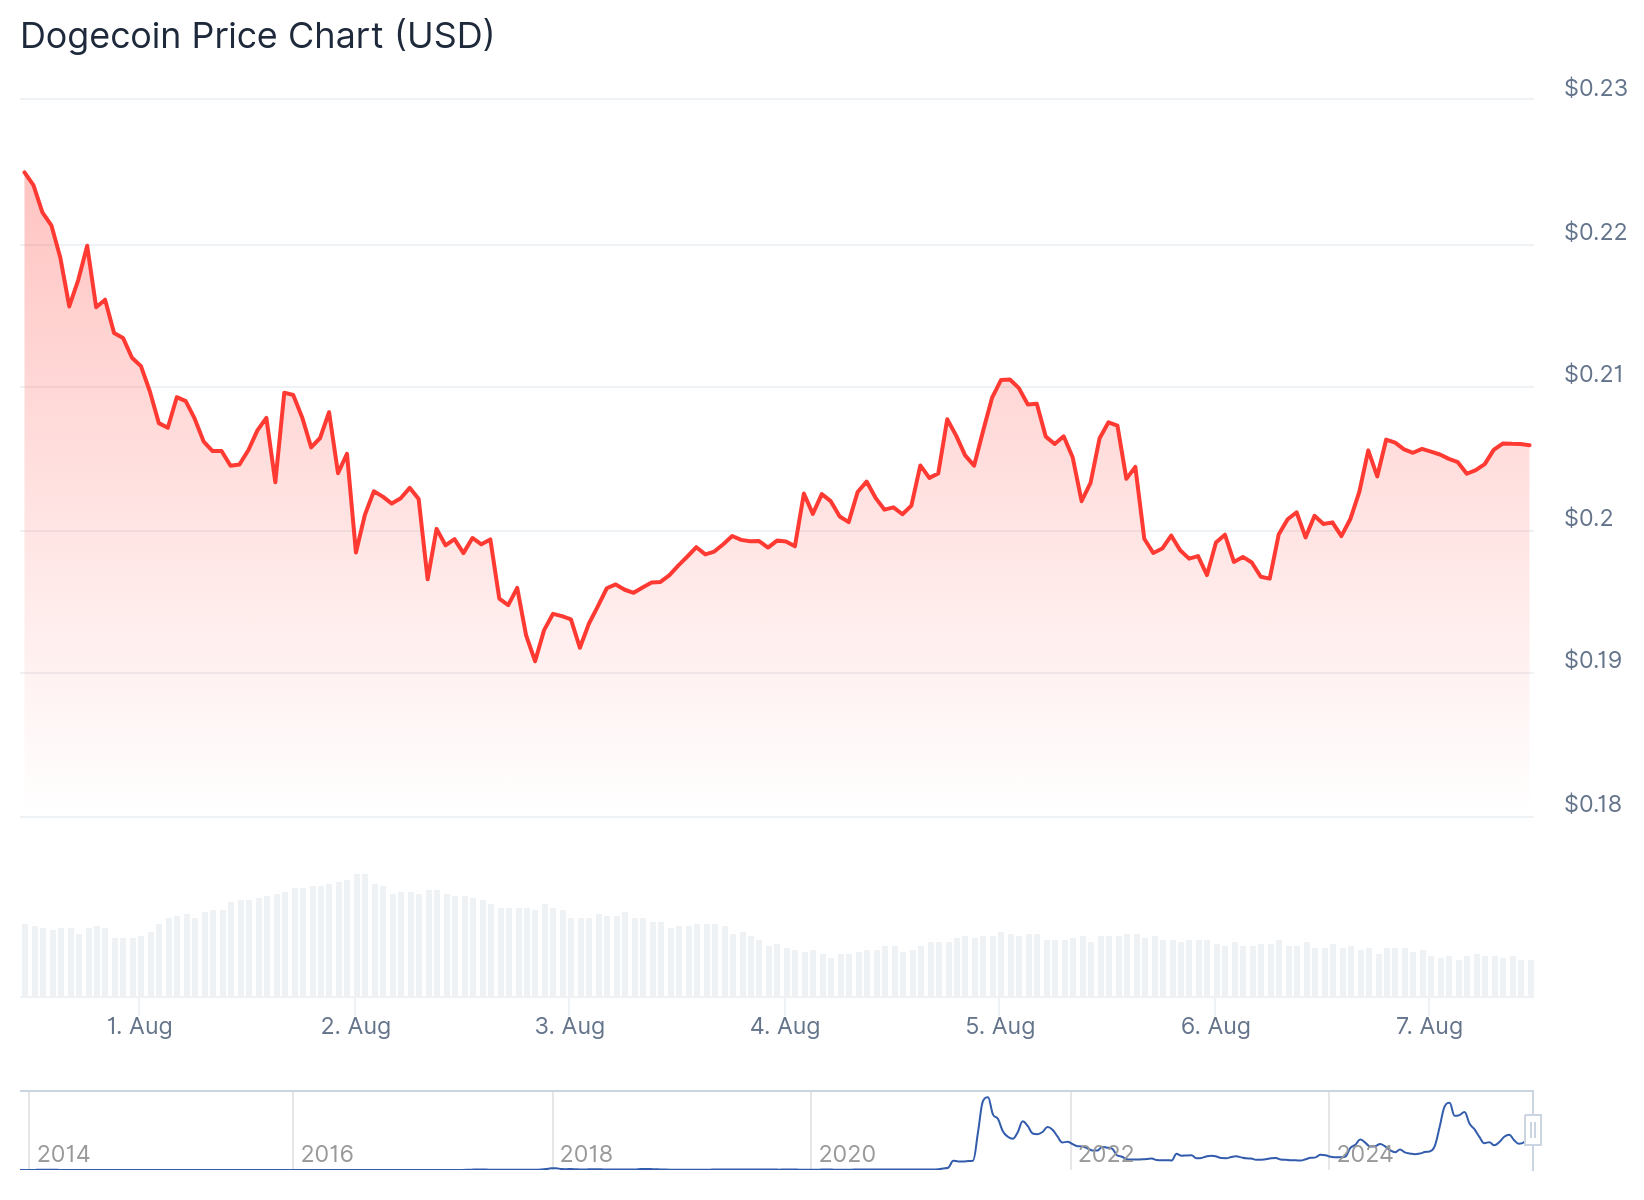
The selloff has brought Dogecoin price to test support below both the 50-day and 200-day exponential moving averages. Bulls have managed to defend the $0.19 level so far, suggesting dip buyers remain active at these prices.
If this support fails on high volume, bears could target the next major support zones at $0.17 and $0.15. These levels represent potential discounts of 12% to 24% from current prices and align with high liquidity areas on the chart.
A successful bounce from $0.19 WOULD open the path for a recovery toward the 20-day EMA around $0.22. Further upside could target the $0.22-$0.24 range if momentum returns.
Technical Picture Shows Mixed Signals
The longer-term structure remains constructive following a golden cross between the 20-day and 200-day moving averages in late July. This formation typically indicates bulls maintain control as long as price stays above the slower moving average.
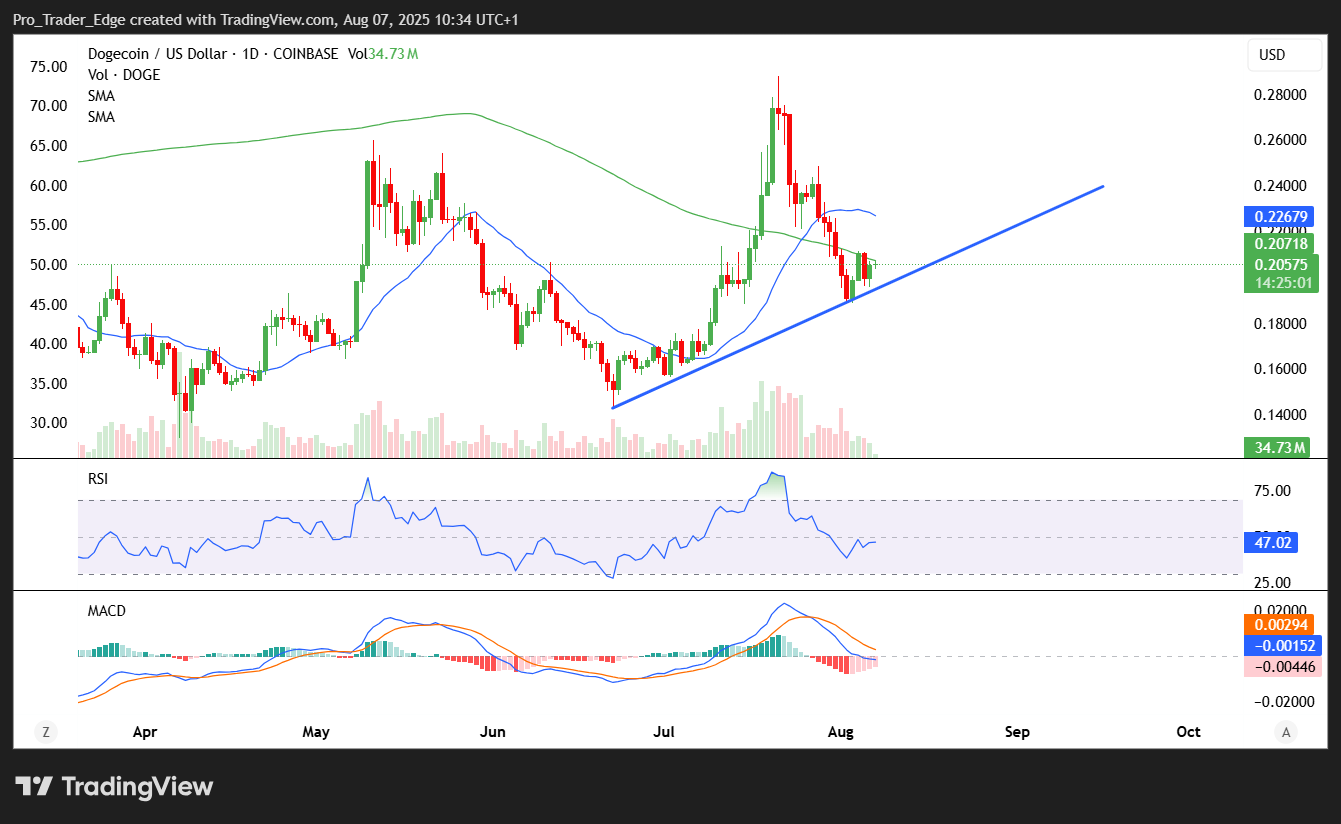
However, momentum indicators paint a different picture. The daily RSI has dropped sharply from overbought readings above 80 to below 50, entering bearish territory. This decline signals the market’s momentum has cooled substantially.
The MACD indicator recently flipped bearish, confirming the recent rally has lost steam. These technical signals suggest traders are now waiting for clearer direction rather than aggressively buying dips.
Despite the technical reset, a hold above $0.19 support could set up a rebound scenario. A break above $0.24 resistance would be needed to target the psychological $0.30 level, though this would likely require positive catalysts.
Macro Factors Create Headwinds
External pressures have contributed to the crypto market decline this week. New import taxes ranging from 10% to 41% on goods from Canada, India, Brazil, Taiwan and other nations have created uncertainty.
The Federal Reserve’s decision to maintain current policy rates has also influenced market sentiment. This stance is expected to continue, prompting investors to shift toward safer assets and away from crypto.
Dogecoin futures volume decreased 37% to $4 billion over 24 hours, though open interest remained stable around $3 billion. This suggests traders are holding positions rather than closing them outright.
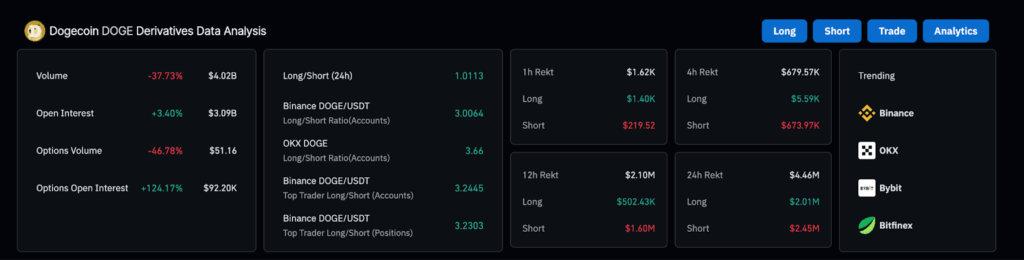
Exchange data shows continued bullish sentiment among traders. Binance reports long accounts outnumbering shorts 3:1, while OKX shows an even stronger 3.6:1 ratio favoring longs.
The stable open interest combined with bullish positioning indicates larger players expect a rebound if support holds and macro conditions improve.
Price action around the $0.19 level will likely determine near-term direction. Equal lows below current levels at $0.18 could attract liquidity-seeking moves before any sustained rally begins.
The daily structure maintains its bullish character with higher highs and higher lows intact. A recent bounce from a demand zone shows the level is being respected by buyers.
Current price action suggests Doge could dip to collect liquidity at $0.18 before moving higher, which would be a normal part of market mechanics rather than a bearish development.
