Dogecoin (DOGE) Primed for Explosion: Technical Signals Point to $1 Breakout

Dogecoin's chart is flashing green—and this time, Wall Street's meme-stock traders might actually be onto something.
Multiple technical patterns are converging, suggesting DOGE could shatter resistance and rally toward the elusive $1 mark. No promises—this is crypto, after all—but the setup looks juicier than a VC's post-pump exit strategy.
Key levels to watch? The 2021 ATH at $0.73 needs to fall first. Break that, and the path clears for a FOMO-fueled march toward triple digits. Just remember: in a market where 'fundamentals' mean Elon's latest tweet, even perfect patterns can get rug-pulled by a single whale.
TLDR
- Dogecoin price successfully retested $0.24 breakout level and bounced, confirming bullish continuation pattern
- Weekly triangle formation suggests potential vertical rally to $1 if current trend continues
- Technical analysts spot double bottom breakout pattern with $0.26 as key resistance level
- BitGuru forecasts 30% rally from current levels based on fractal analysis
- Multiple analysts project targets between $0.45-$1 for this cycle
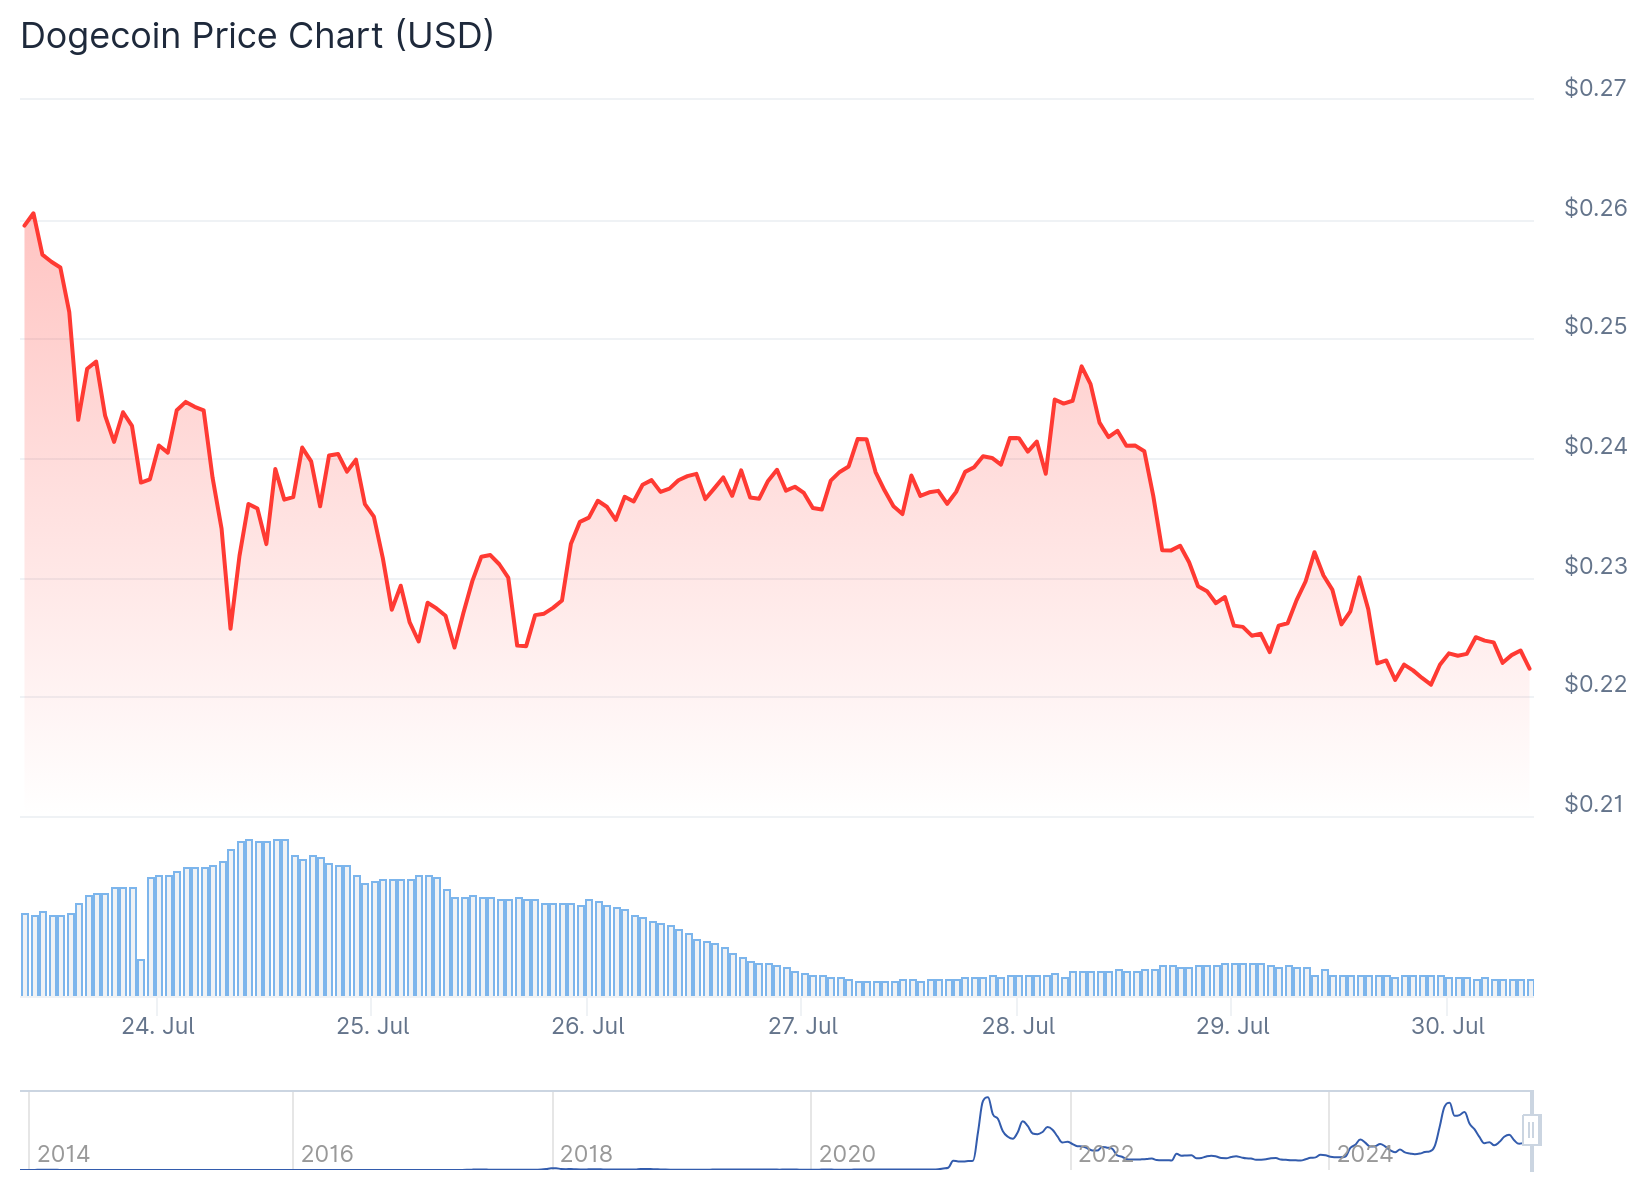
Dogecoin price has shown resilience after dropping 16% over the past week. The meme coin reclaimed the $0.24 zone following a successful retest of its breakout from a descending trendline.
Technical analyst Hailey LUNC identified a pattern similar to DOGE’s Q4 2023 breakout setup. The current cycle shows Doge breaking above long-standing resistance before pulling back into consolidation.
Price has rebounded from the top of this range and currently trades around $0.23382. This movement shows the reversal of resistance to support, a bullish development for the cryptocurrency.
$DOGE retested the breakout.
Looks like it's time for the uptrend to continue. pic.twitter.com/j75hgqGeXh
— Hailey LUNC ✳️ (@TheMoonHailey) July 28, 2025
Hailey’s projection targets $0.47411, marked by a green box on the chart. This mirrors the previous breakout pattern that led to an explosive MOVE after retesting similar areas.
Both events followed prolonged downtrends and low-volatility periods. The revised technicals suggest Doge price remains on track for continuation if it stays above $0.228.
Weekly Triangle Points to $1 Target
Trader Tardigrade has identified a long-term triangle structure on the weekly chart. DOGE price is currently forming Triangle III, following the same ascending pattern seen in previous bull cycles.
$Doge/W1#Dogecoin is set to move vertically to $1, along the side of Triangle III 🔥 pic.twitter.com/tErtxmNEAo
— Trader Tardigrade (@TATrader_Alan) July 28, 2025
The two previous triangles were followed by vertical price movements at the upper trend line. Tardigrade’s analysis shows a clear pattern of breakout, parabolic rally, consolidation, then repeat.
All previous rallies were supported by a macro trend line established in 2014 that remains unbroken. DOGE price recently bounced from the base of Triangle III, positioning it for the next leg up.
The structure suggests a breakout similar to 2021. Volume remains modest but is rising steadily according to the chart analysis.
A break past $0.38 could drive the price to the $1 area. This move might happen sooner than expected if the fractal pattern continues.
Double Bottom Formation Gains Attention
Ali Martinez pointed to a double bottom breakout pattern forming on DOGE charts. He noted that if DOGE price can reclaim $0.26 as support, it could open a path toward $0.46.
If Dogecoin $DOGE is truly forming a double bottom, this is the spot for a rebound. Reclaiming $0.26 as support could set the stage for a rally toward $0.46! pic.twitter.com/L9IgDef4Ia
— Ali (@ali_charts) July 25, 2025
Other analysts including RonnieV and Kamran Asghar have shared similar views. Kamran Asghar believes DOGE is preparing for a major move based on the double bottom and breakout pattern.
Technical indicators show mixed signals. The Relative Strength Index (RSI) has risen above 55 on the daily timeframe, exiting neutral territory and suggesting increasing strength.
However, the MACD histogram shows a bearish cross as the signal line crossed above the MACD line. The histogram bars are decreasing in magnitude, indicating declining trend strength.
Volume has increased in the last three sessions. Every advance beyond $0.24 has featured above-average inflows, confirming breakout interest.
Dogecoin Swing Trade Idea 📈$DOGE is looking bullish on the weekly chart 🚀
🔹 Entry: $0.215
🔹 TP1: $0.35 ➡️ TP2: $0.49
🔹 Stop Loss: $0.15
🔹 Risk:Reward: 1:3#Crypto #DOGE #Trading pic.twitter.com/l7O4kTqOjG
— Trader Edge (@Pro_Trader_Edge) July 29, 2025
BitGuru provided a short-term perspective using a 4-hour chart formation. His analysis shows a rounded base around $0.22 followed by a measured grind to $0.243.
A similar formation in the previous month led to a 31% breakout to $0.28667. BitGuru expects a move to $0.28 if DOGE price manages to rise above $0.247.
The setup shows an obvious breakout region and reaction off $0.22 support. BitGuru emphasized that DOGE has bounced off $0.22 and is grinding at $0.243 with volume building.
DOGE currently trades with key support zones holding NEAR $0.2320. A move above $0.2360 could lead to a retest of the $0.2400 area according to current technical analysis.
