Pudgy Penguins (PENGU) Primed for Explosion: Bull Flag Breakout Signals 100%+ Rally Ahead

PENGU just cracked the pattern every trader craves—and the charts scream upside.
The Setup: Pudgy Penguins coiled into a textbook bull flag after ripping 300% off its June lows. Now the breakout triggers.
Why It Matters: Flags fly half-mast before the real surge. Measured move targets put PENGU at 2.3x current levels if volume confirms.
Caution Flags: Memecoins love to fake out retail—watch for sustained closes above $4.20 (because of course that's the resistance level) before YOLOing in.
Bottom Line: Either we're early to the next NFTfi narrative or late to another 'utility' ponzi. Place your bets.
TLDR
- PENGU price has stabilized above $0.036 after reclaiming crucial support at $0.033, with technical indicators showing bullish momentum through RSI at 64.04 and positive MACD crossover
- Open interest has surged to $591 million with derivatives volume exceeding $4.4 billion, indicating strong trader conviction and leveraged positions
- PENGU has overtaken TRUMP to become the second-largest memecoin on Solana by market cap at $2.32 billion
- Whale accumulation has increased sharply since late June, with holdings rising alongside price movements showing institutional confidence
- Technical analysis reveals a bull flag breakout pattern with Fibonacci targets at $0.045 and potential resistance thinning above current levels
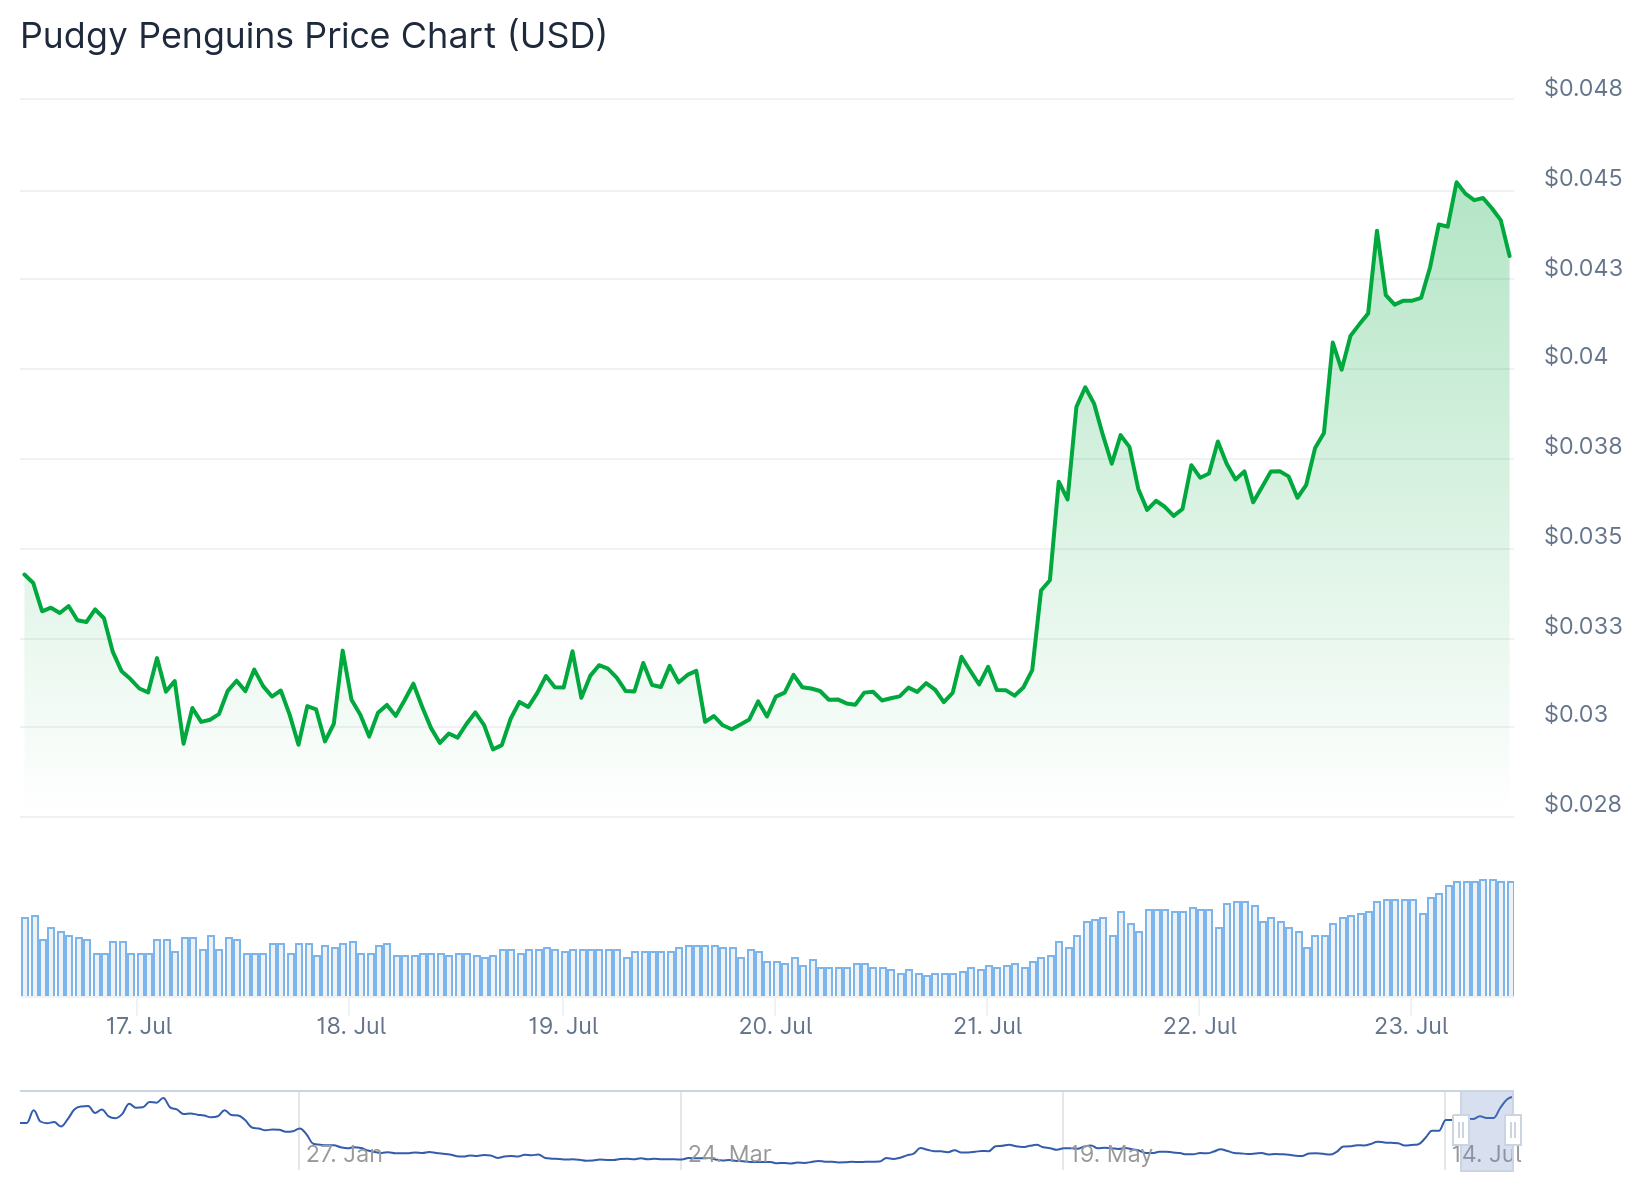
Pudgy Penguins has shown strong technical momentum after reclaiming key support levels. The token has stabilized above $0.036 following a recovery from the crucial $0.033 support zone.
Open interest in PENGU derivatives has climbed to $591 million. Total derivatives volume has exceeded $4.4 billion, representing a 291.97% increase.
The MACD indicator shows bullish signals with the MACD line at 0.00058 positioned above the signal line at 0.00057. This crossover pattern typically indicates upward momentum continuation.
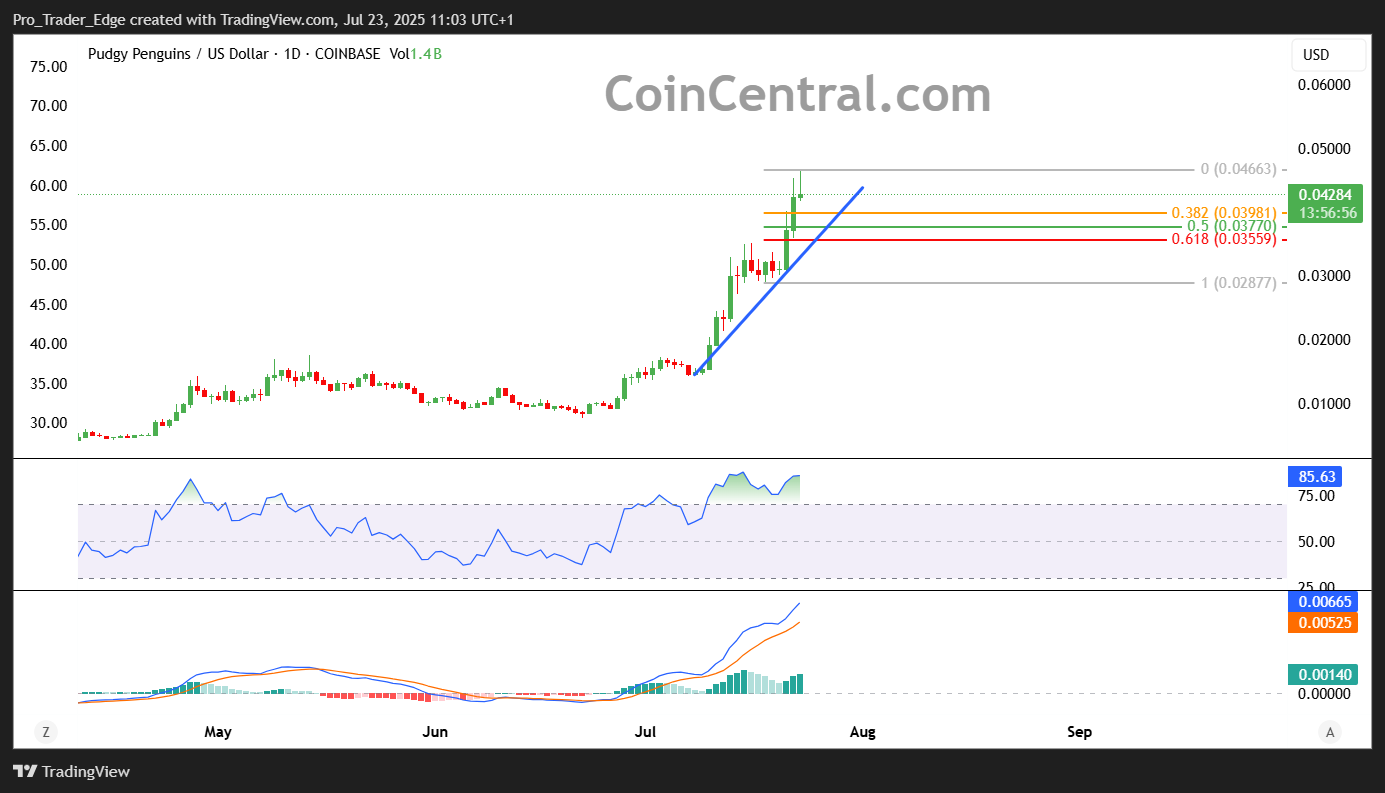
RSI readings stand at 64.04, well above the neutral 50 level but below overbought territory. The indicator shows no bearish divergence, with recent price drops recovering quickly.
Current price action shows consolidation around $0.036 after reaching $0.03678. This level sits just below the Fibonacci 1.618 extension at $0.03846.
The Volume Weighted Average Price (VWAP) matches the current market price at $0.03640. This alignment suggests PENGU trades within its average value range without overheating.
Trading volume has reached over 38 million tokens in the past 24 hours. This volume supports the current bullish trend structure.
Market Position Strengthens on Solana
PENGU has achieved a major milestone by overtaking TRUMP to become Solana’s second-largest memecoin by market capitalization. The token now holds a $2.32 billion market cap compared to TRUMP’s $2.30 billion.
This ranking change occurred as PENGU broke out of a descending trendline pattern. The breakout showed a clean retest of the trendline, suggesting renewed bullish momentum.
The 15-minute chart displays a textbook bull flag formation. After an initial vertical impulse, price moved into a clean consolidation range before breaking higher.
It's happening! $PENGU https://t.co/eI6njclUYh pic.twitter.com/QHDGTsoDXY
— Ali (@ali_charts) July 22, 2025
Fibonacci Levels Guide Price Targets
Key Fibonacci support levels include 0.786 at $0.03395 and 0.618 at $0.03290. PENGU previously touched the 0.5 Fibonacci level at $0.03142 during its upward trajectory.
The price structure shows well-built momentum with proper pullbacks and volume confirmations. Lower Fibonacci levels at $0.030 and $0.032 represent areas where buyers previously entered.
Volume profile analysis reveals dramatically reduced overhead supply above current levels. This thin resistance could enable price discovery if momentum continues.
Target levels include the 2.618 Fibonacci extension at $0.0450 and the 3.618 extension at $0.0585. These represent potential upside objectives if the breakout sustains.
Whale activity data shows sharp accumulation increases since late June. Holdings have risen alongside price movements, indicating institutional confidence behind the rally.
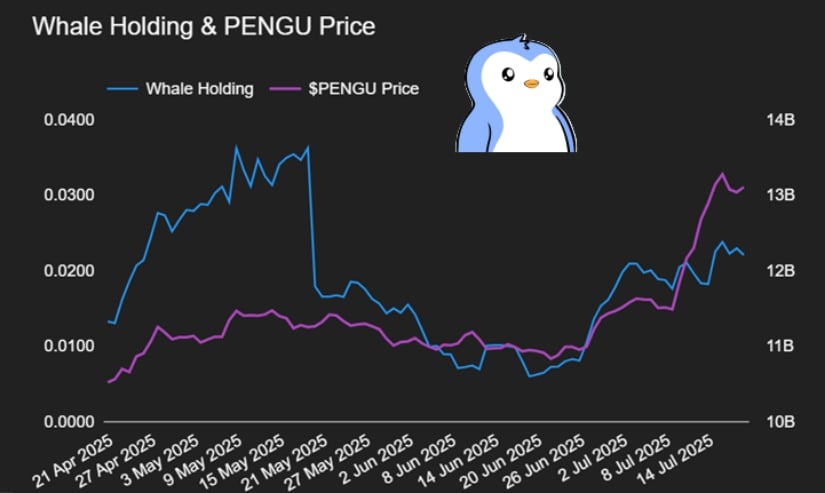
The correlation between whale accumulation and price increases suggests this MOVE extends beyond retail participation. Early whale accumulation in late June occurred during price consolidation phases.
Current derivatives data shows Leveraged exposure playing a major role in price movement. The combination of rising open interest and price increases indicates trend continuation rather than spot-driven moves alone.
PENGU price maintains its bullish structure as long as price holds above the $0.032 Fibonacci region. The $0.030 support level coincides with earlier resistance from this month.
A break above $0.038 could trigger additional leveraged position entries, creating increased buying pressure and volatility.
