Crypto Market Tanks: The Real Reasons Behind Today’s Bloodbath

Crypto's taking a beating today—but this isn't just another 'buy the dip' meme. Here's what's really driving the sell-off.
Macro Mayhem: Traders are dumping risk assets after the Fed's latest hawkish pivot. Bitcoin's still trading like a tech stock, and Wall Street's algos don't care about your HODL convictions.
Liquidity Crunch: Thin summer volumes are amplifying moves. One whale dumps, the whole market follows—classic crypto 'efficiency' at work.
Derivatives Domino Effect: Leverage gets liquidated, triggering more liquidations. Rinse and repeat until your portfolio looks like a crime scene.
Silver lining? These shakeouts vaporize weak hands. Just ask the 'stablecoin yield farmers' who thought 20% APY was sustainable. (Spoiler: They're now bagholding Terra 2.0 tokens.)
TLDR
- Bitcoin falls below $117,000 with 1% daily decline as profit-taking follows recent highs
- Ethereum drops to $3,700, down 1.2% in 24 hours as market cap slips to $3.9 trillion
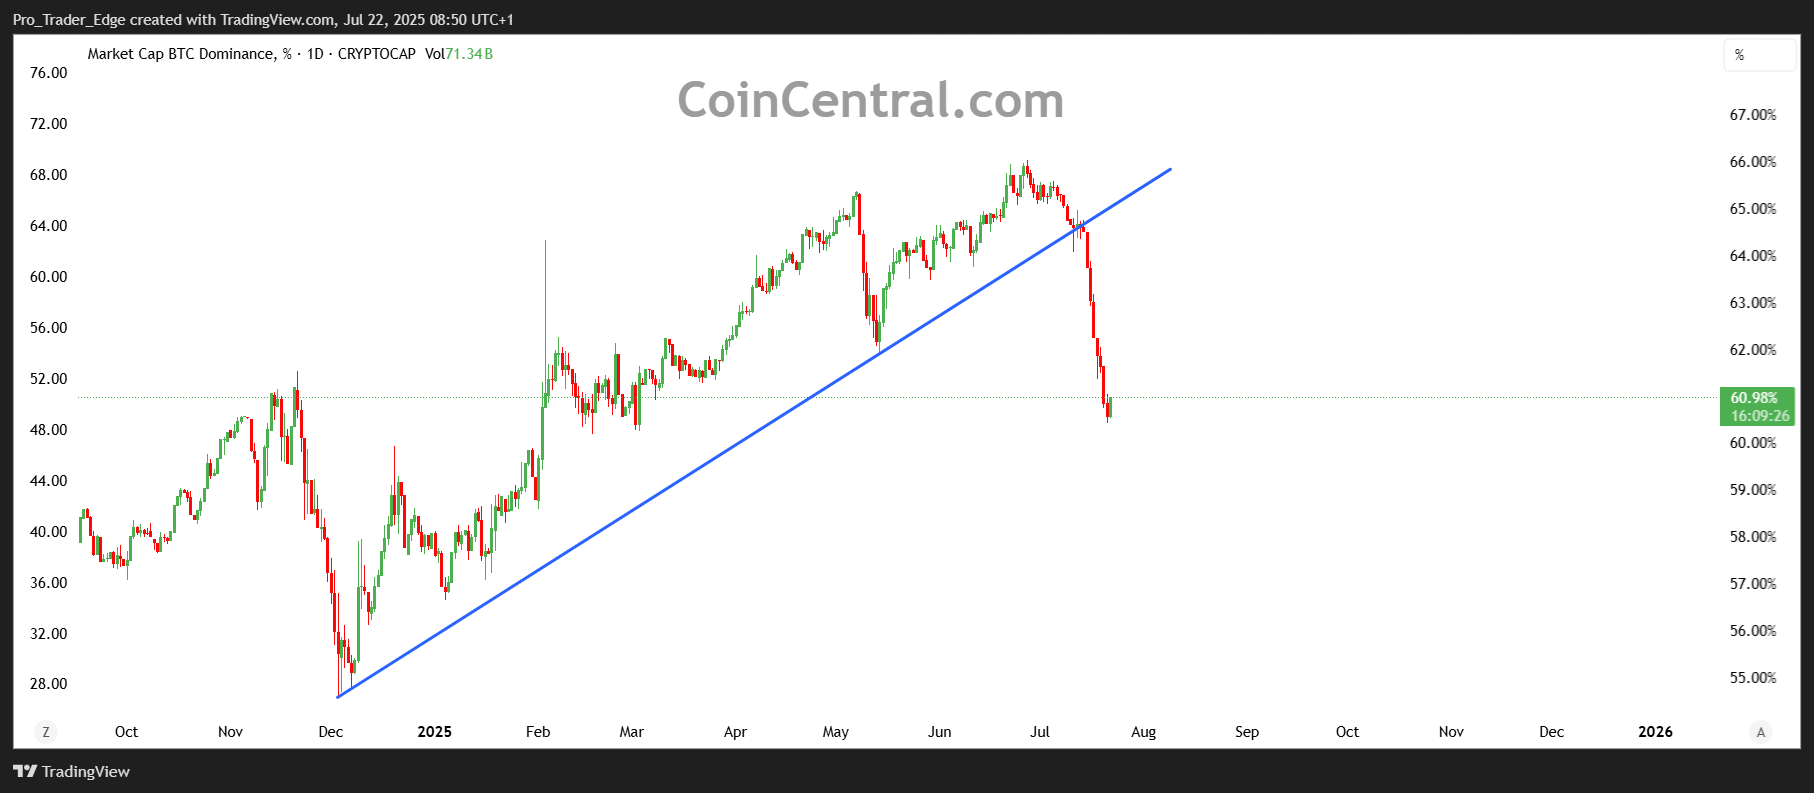
- Solana breaks $200 barrier with 12% surge while Bitcoin dominance drops below 60%
- Technical resistance at $119,000 holds back Bitcoin’s upward movement during consolidation phase
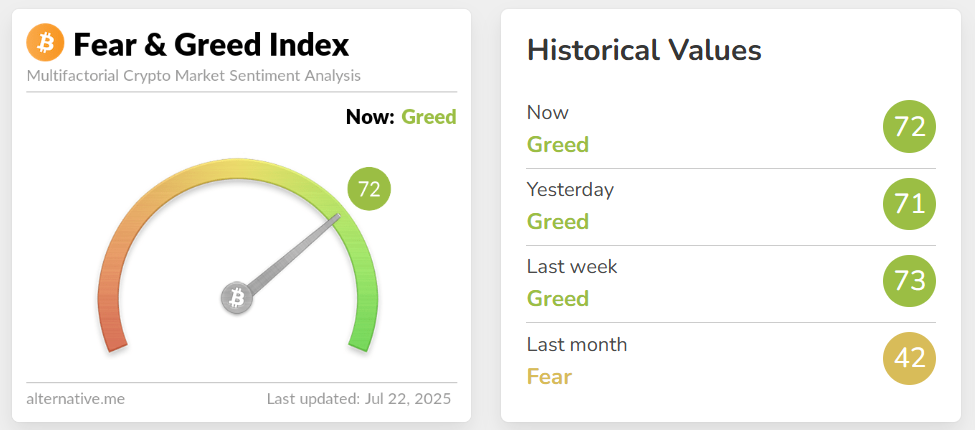
- Fear and Greed Index moves from “greed” to neutral as investors adopt wait-and-see approach
The cryptocurrency market showed mixed performance on July 22, 2025, with Bitcoin retreating from recent highs while select altcoins posted strong gains. Many investors are asking why is crypto down today as the total crypto market cap declined to approximately $3.9 trillion with most major digital assets trading in the red.
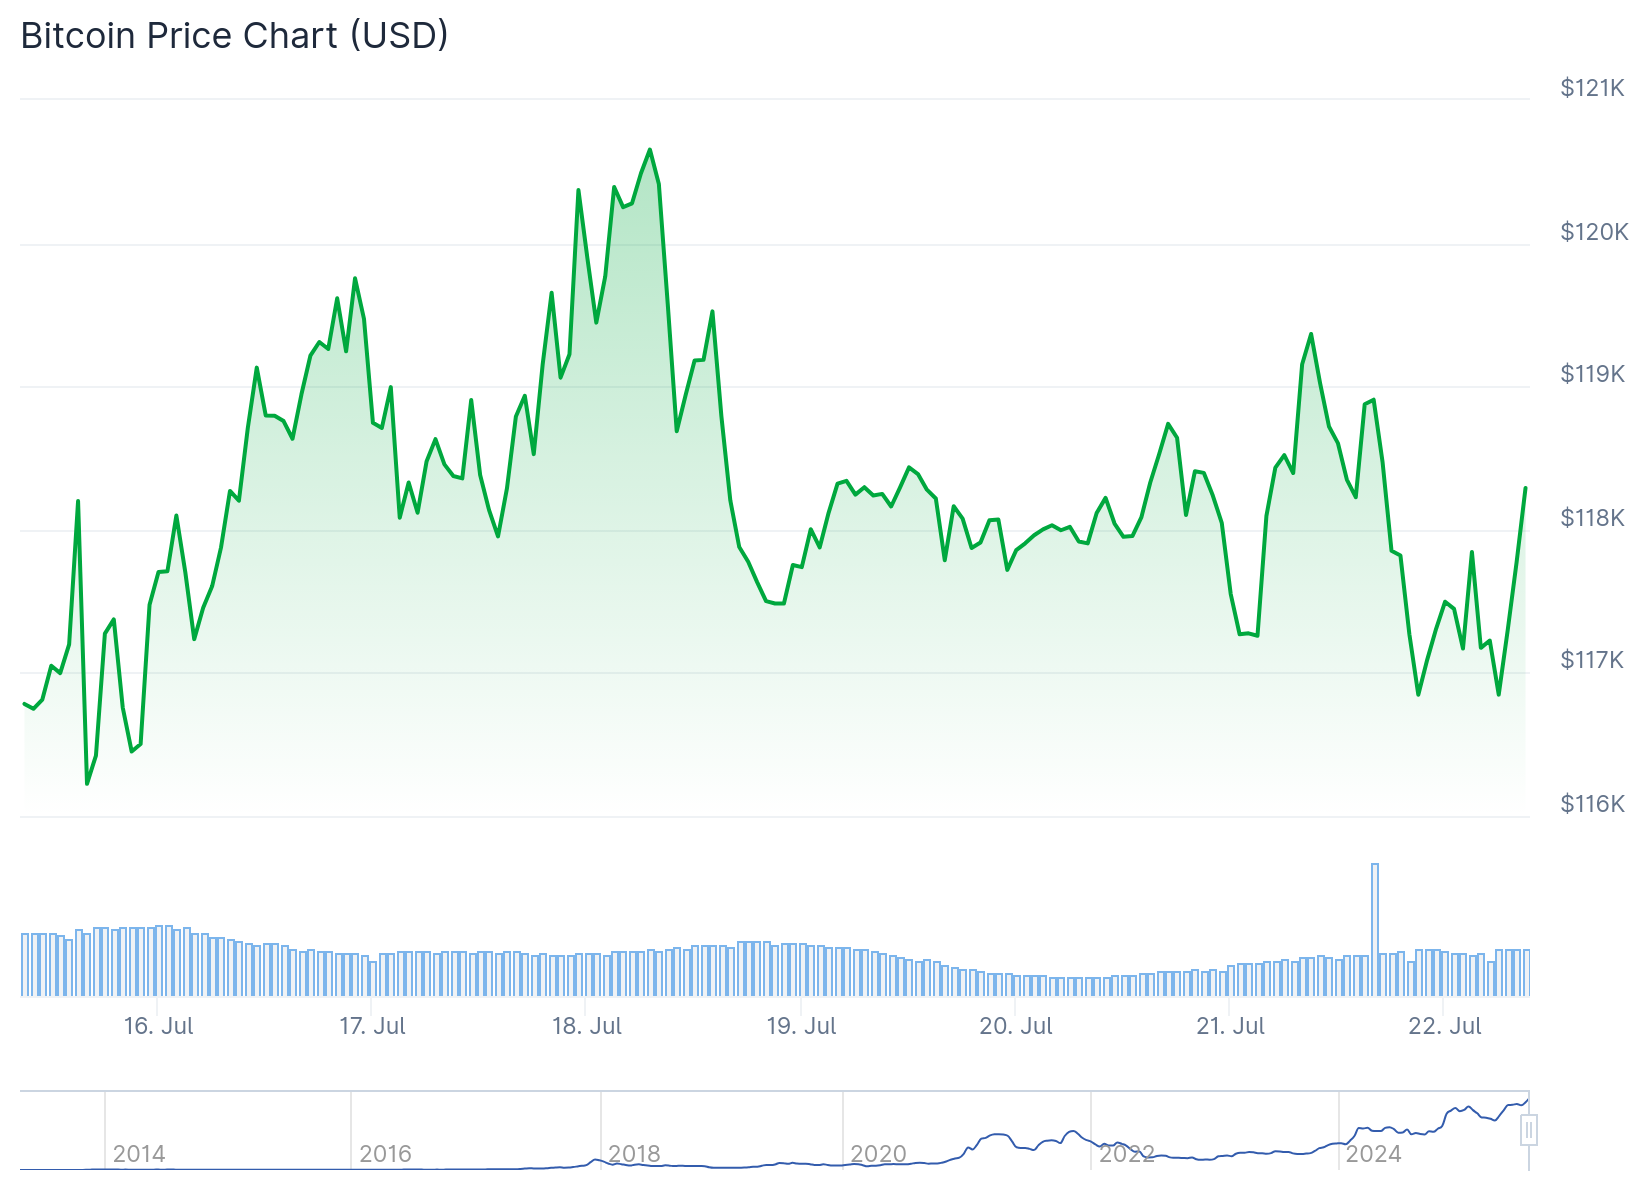
Bitcoin fell below the $117,000 level, declining about 1% on the day. The world’s largest cryptocurrency currently trades in a range between $116,900 and $117,200. Ethereum followed suit, dropping to around $3,700 with a 1.2% decline over 24 hours.
The primary driver behind today’s downturn appears to be profit-taking activity. Bitcoin and several altcoins reached all-time or multi-month highs over the past week. Traders have begun locking in gains from these recent rallies, creating increased selling pressure across the market.
Technical factors also contribute to the current market conditions. bitcoin remains in what analysts describe as a consolidation phase, fluctuating between $116,000 and $120,000. The cryptocurrency faces strong resistance near the $119,000 level, which continues to limit upward movement.
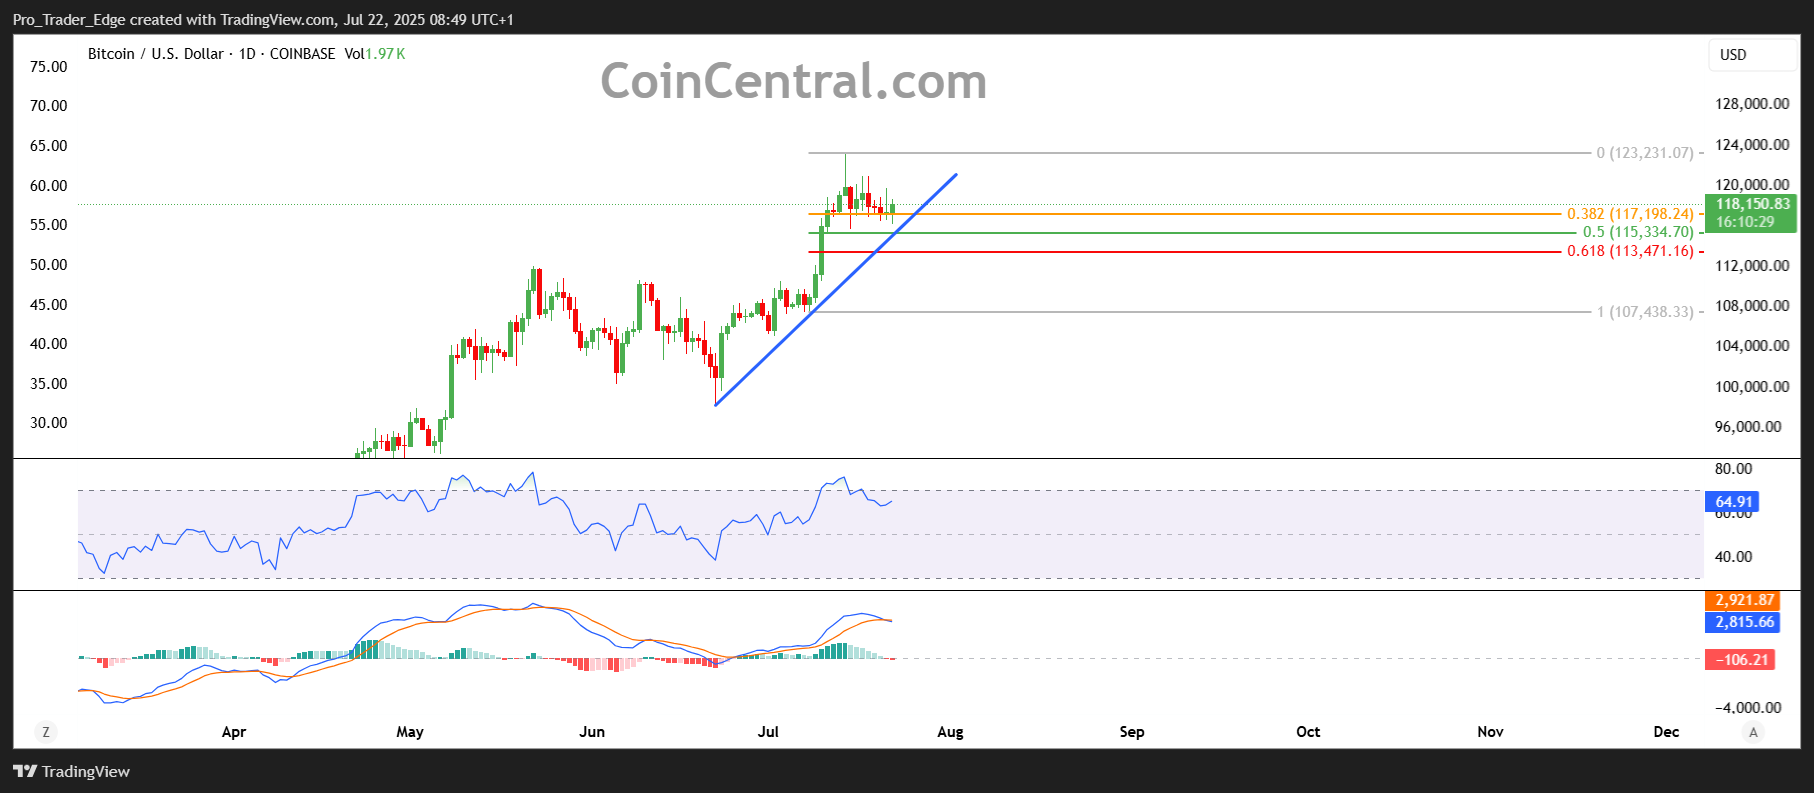
Chart indicators suggest weakening momentum for Bitcoin. Technical signals including MACD crossover patterns point to potential further declines in the NEAR term. These technical triggers have prompted quick reactions from traders monitoring such signals.
Understanding why is crypto down today requires examining multiple market forces at work. Liquidations of Leveraged trading positions have increased slightly, adding to the selling pressure. The combination of technical sell signals and liquidation activity compounds the current market decline.
Altcoin Rotation Drives Market Dynamics
A shift in capital allocation has become evident as Bitcoin dominance drops below 60% for the second time in three months. Investors are rotating funds from Bitcoin into alternative cryptocurrencies and memecoins. This rotation reflects changing investor preferences in the current market cycle.
Solana emerged as the day’s standout performer, surging over 12% to break through the $200 price barrier. The altcoin bucked the broader market trend, attracting investor attention away from Bitcoin and Ethereum. Pudgy Penguins memecoin also posted strong gains, climbing 15% during the session.
The altcoin season index crossed above 50, indicating that capital flows favor non-Bitcoin assets. This metric suggests a broader shift in market dynamics as investors seek opportunities beyond the largest cryptocurrency. Tezos moved in the opposite direction, falling 10.6% to $0.98.
Despite the question of why is crypto down today, certain sectors show resilience. The memecoin category continues to attract speculative capital as traders seek higher returns. This divergence highlights the complex nature of current market conditions.
Market Sentiment and Technical Indicators
Market sentiment indicators show a transition from “greed” to more neutral territory. The Fear and Greed Index reflects increased caution among investors after rapid price increases in previous trading sessions. This shift suggests a more measured approach as market participants reassess recent gains.
The answer to why is crypto down involves examining investor psychology and technical patterns. Chart analysis reveals Bitcoin testing key support levels while facing resistance at higher prices. These technical barriers create natural pause points for price action.
Institutional flows present a mixed picture despite the market retreat. Some spot Bitcoin and ethereum ETFs continue to see inflows, but this institutional buying has not offset retail profit-taking and increased exchange selling volume. Trading volumes remain elevated as market participants adjust their positions.
The current market conditions reflect a natural pullback following strong recent performance. Bitcoin’s consolidation phase continues as the cryptocurrency tests support and resistance levels established over recent weeks. Market participants continue monitoring these levels for future direction signals.
