🚀 Bitcoin (BTC) Primed for Explosive Rally: Fresh Liquidity Could Propel Price to $136,000

Bitcoin's gearing up for a moonshot—and Wall Street's latest liquidity dump might just be the rocket fuel.
The setup: A tidal wave of fresh capital sloshing into crypto markets could ignite BTC's next leg up. We're talking multi-week rally territory, with $136K in the crosshairs.
Why it matters: When liquidity floods the system, digital gold tends to float higher—while traditional finance bros still can't decide if crypto's 'a real asset class' (spoiler: it is).
The kicker: This isn't hopium—it's simple market mechanics. More dollars chasing finite BTC supply equals upward pressure. Just don't tell the Fed.
TLDR
- Bitcoin (BTC) hit a new all-time high of $123,000 before correcting to around $118,250-$119,000
- Short-Term Holder Unrealized Profit data suggests Bitcoin hasn’t reached its local top yet, with room for further growth
- Over $2 billion in fresh stablecoins were deposited into derivatives exchanges, indicating increased appetite for leveraged positions
- Technical analysis points to a potential target of $136,000 based on the Short-Term Holder Cost Basis Model
- Key support levels exist at $101,000-$109,000 and $93,000-$97,000 if the current rally fails
Bitcoin recently reached a new all-time high of $123,000 before pulling back to current levels around $118,250-$119,000. Despite this correction, market data suggests the flagship cryptocurrency’s rally may have more room to run.

The pullback appears to be part of a normal corrective phase rather than a major trend reversal. Multiple technical indicators point to continued upside potential in the coming weeks.
Analysis of Bitcoin’s Short-Term Holder Unrealized Profit metric reveals the asset remains in neutral territory. This indicator divides market behavior into three zones: neutral (blue), heated (yellow), and overheated (red).

Historically, local tops formed when this metric entered the heated range, such as in January and April 2024. However, Bitcoin has remained below the heated zone during its recent rally, indicating further room for growth.
The Volume-Weighted Average Price liquidity chart confirms this bullish bias. The price remains above the VWAP line, supporting continued upward momentum.
Bitcoin is currently on day 12 of its expansion cycle according to the Optimal Signal indicator. Previous rallies lasted thirty days each, with expansion phases typically lasting 15-30 days.
This suggests up to 18 days remain for upside continuation if bitcoin mirrors previous patterns. The timing analysis provides a framework for the potential duration of the current move.
Fresh Stablecoin Inflows Signal Institutional Demand
More than $2 billion worth of stablecoins, primarily Tether (USDT), were deposited into major derivatives trading platforms. This surge in inflows signals increased appetite for Leveraged positions among seasoned traders.
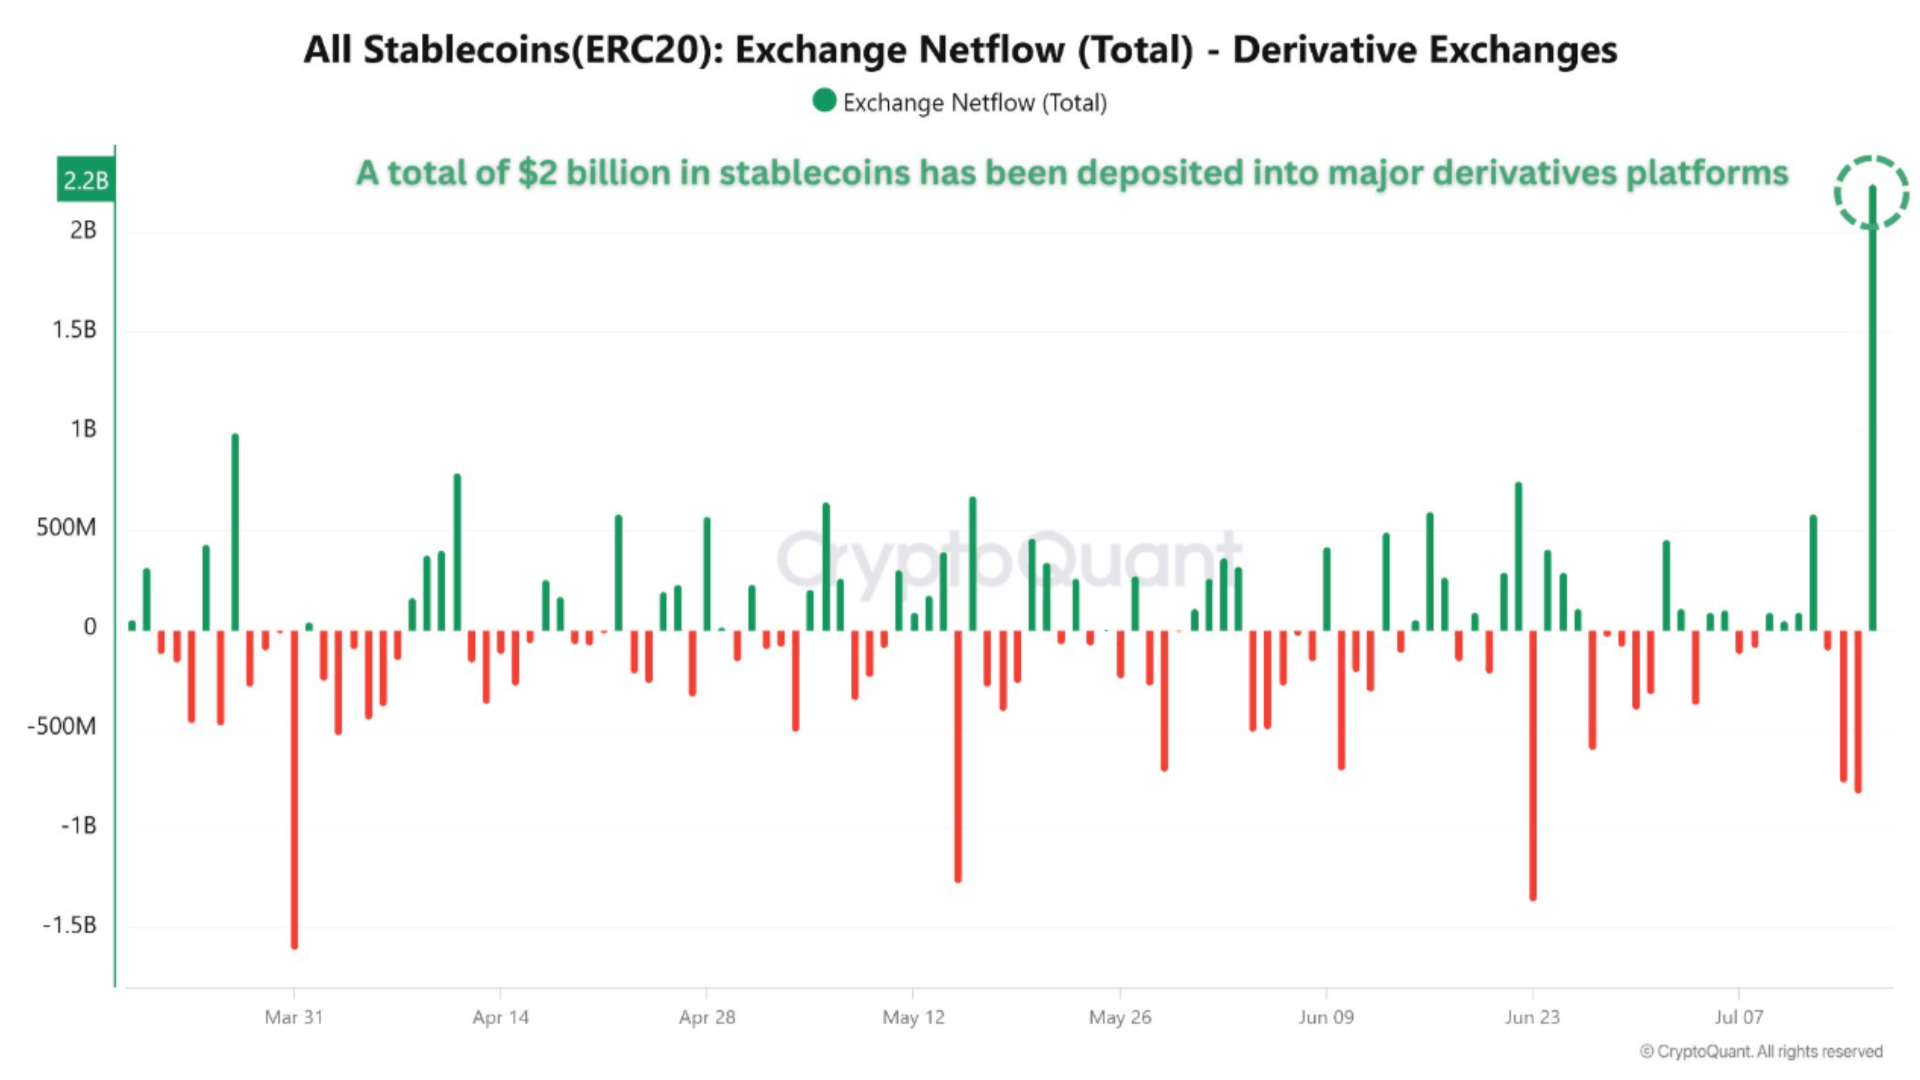
The fresh batch of USDT was minted by Tether Treasury, suggesting institutional demand is driving the activity. Large-scale stablecoin inflows have historically preceded bullish market momentum.
Traders often use stablecoins to open long positions on Bitcoin and altcoin futures and perpetual contracts. Rapid stablecoin deposits into derivatives exchanges frequently act as a leading indicator for major price rallies.
Rising Open Interest alongside BTC’s price increase represents a classic signal of strong bullish sentiment. More traders are opening positions expecting further upside, indicating increasing market participation.
The Coinbase Premium Index remains above zero, showing US-based buyers are paying a premium over global spot prices. This indicator currently sits within a ‘Breaker’ structure.
Technical Target Points to $136,000
The Short-Term Holder Cost Basis Model suggests Bitcoin could rally toward $136,000. This level aligns with the +2 standard deviation band, also known as the heated region.
The heated region has historically preceded market corrections, making it a key level to watch. If Bitcoin reaches this target, it WOULD represent another substantial gain from current levels.

However, if Bitcoin fails to gain upward momentum and continues its descent, two critical support zones come into play. The first sits between $101,000 and $109,000, a region that previously acted as an accumulation zone.
The second support band sits lower between $93,000 and $97,000. If Bitcoin falls into the first cluster and fails to bounce meaningfully, a drop toward the second support band becomes more likely.
A failure to hold above $118,000 could drag Bitcoin below the psychological $100,000 level toward historic support areas. These levels represent important technical zones for traders to monitor.
BTC deposits to exchanges spiked after the digital asset hit its recent high around $123,000. This pattern often precedes local tops and is typically followed by a price correction.
Despite recent profit-taking activity, Bitcoin has not experienced a major price drop, pointing to robust underlying demand. The asset currently trades at $119,171, up 2.4% in the past 24 hours.
