Bitcoin (BTC) Tumbles Below $116K as June CPI Inflation Data Rattles Markets

Bitcoin's bull run hits a speed bump—CPI numbers just threw cold water on the party.
Inflation's ghost haunts crypto again
BTC sliced through $116,000 like a hot knife through butter after the Fed's favorite inflation metric landed with a thud. No surprise here—traders still panic-sell at the first whiff of macroeconomic trouble, proving crypto's 'uncorrelated asset' narrative remains as shaky as a meme coin's fundamentals.
When will markets learn? Every CPI report turns crypto traders into Pavlov's dogs—salivating at rate cuts, whimpering at hot prints. Meanwhile, Wall Street sharks keep feasting on both sides of the volatility.
Silver lining? These pullbacks separate diamond hands from paper-handed tourists. The real OGs know: Bitcoin eats inflation for breakfast... eventually.
TLDR
- Bitcoin fell to $116,000 after June CPI data showed rising inflation for the second straight month
- Core CPI hit 2.9% annually while headline CPI reached 2.7%, the highest since February
- Rising inflation reduced expectations for a July interest rate cut, with markets now pricing 54.3% chance of September cut
- Bitcoin needs to reclaim $119,250-$120,700 zone to confirm bullish momentum and target fresh highs above $123,000
- Technical analysis suggests deeper correction likely with support zones at $113,700-$115,300 and $112,000
Bitcoin price dropped below $116,000 following the release of June US Consumer Price Index data that showed inflation rising for the second consecutive month. The world’s largest cryptocurrency faced selling pressure as investors reassessed their interest rate cut expectations.
The June CPI report revealed headline inflation reached 2.7% year-over-year, matching expectations but representing an increase from May’s 2.4%. This marked the highest inflation reading since February, raising concerns about the Federal Reserve’s monetary policy direction.
The Consumer Prices Index (CPI) ROSE by 3.6% in the 12 months to June 2025, up from 3.4% in the 12 months to May.
Read the full article ➡️ https://t.co/dtb7FWO7pw pic.twitter.com/3oIGRpKqCw
— Office for National Statistics (ONS) (@ONS) July 16, 2025
Core CPI, which excludes volatile food and energy prices, ticked higher to 2.9% annually. While this came in slightly below the 3% forecast, it still represented an upward trend that markets found concerning. Monthly CPI rose 0.3%, marking the sharpest gain in five months.
The inflation data particularly highlighted sticky price pressures in food and transportation sectors. Shelter costs, which represent a large portion of the CPI basket, showed only marginal easing. This persistent inflation across key sectors reinforced concerns about the Federal Reserve’s ability to cut rates in the NEAR term.
Market Response and Dollar Strength
Markets reacted cautiously to the inflation data, with the US Dollar Index (DXY) surging to 98.5, up 2.1% in July. The dollar’s strength created headwinds for Bitcoin and other risk assets, as investors sought safety in traditional haven assets.
Bitcoin’s correlation with traditional markets became evident as the cryptocurrency struggled to maintain its position above $120,000. The selling pressure intensified as traders positioned for a potentially more hawkish Federal Reserve stance.
According to CME FedWatch, futures pricing now indicates a 54.3% chance of a September rate cut, down from higher probabilities seen earlier. This shift in expectations has created uncertainty about Bitcoin’s near-term trajectory.
Technical Analysis and Key Levels
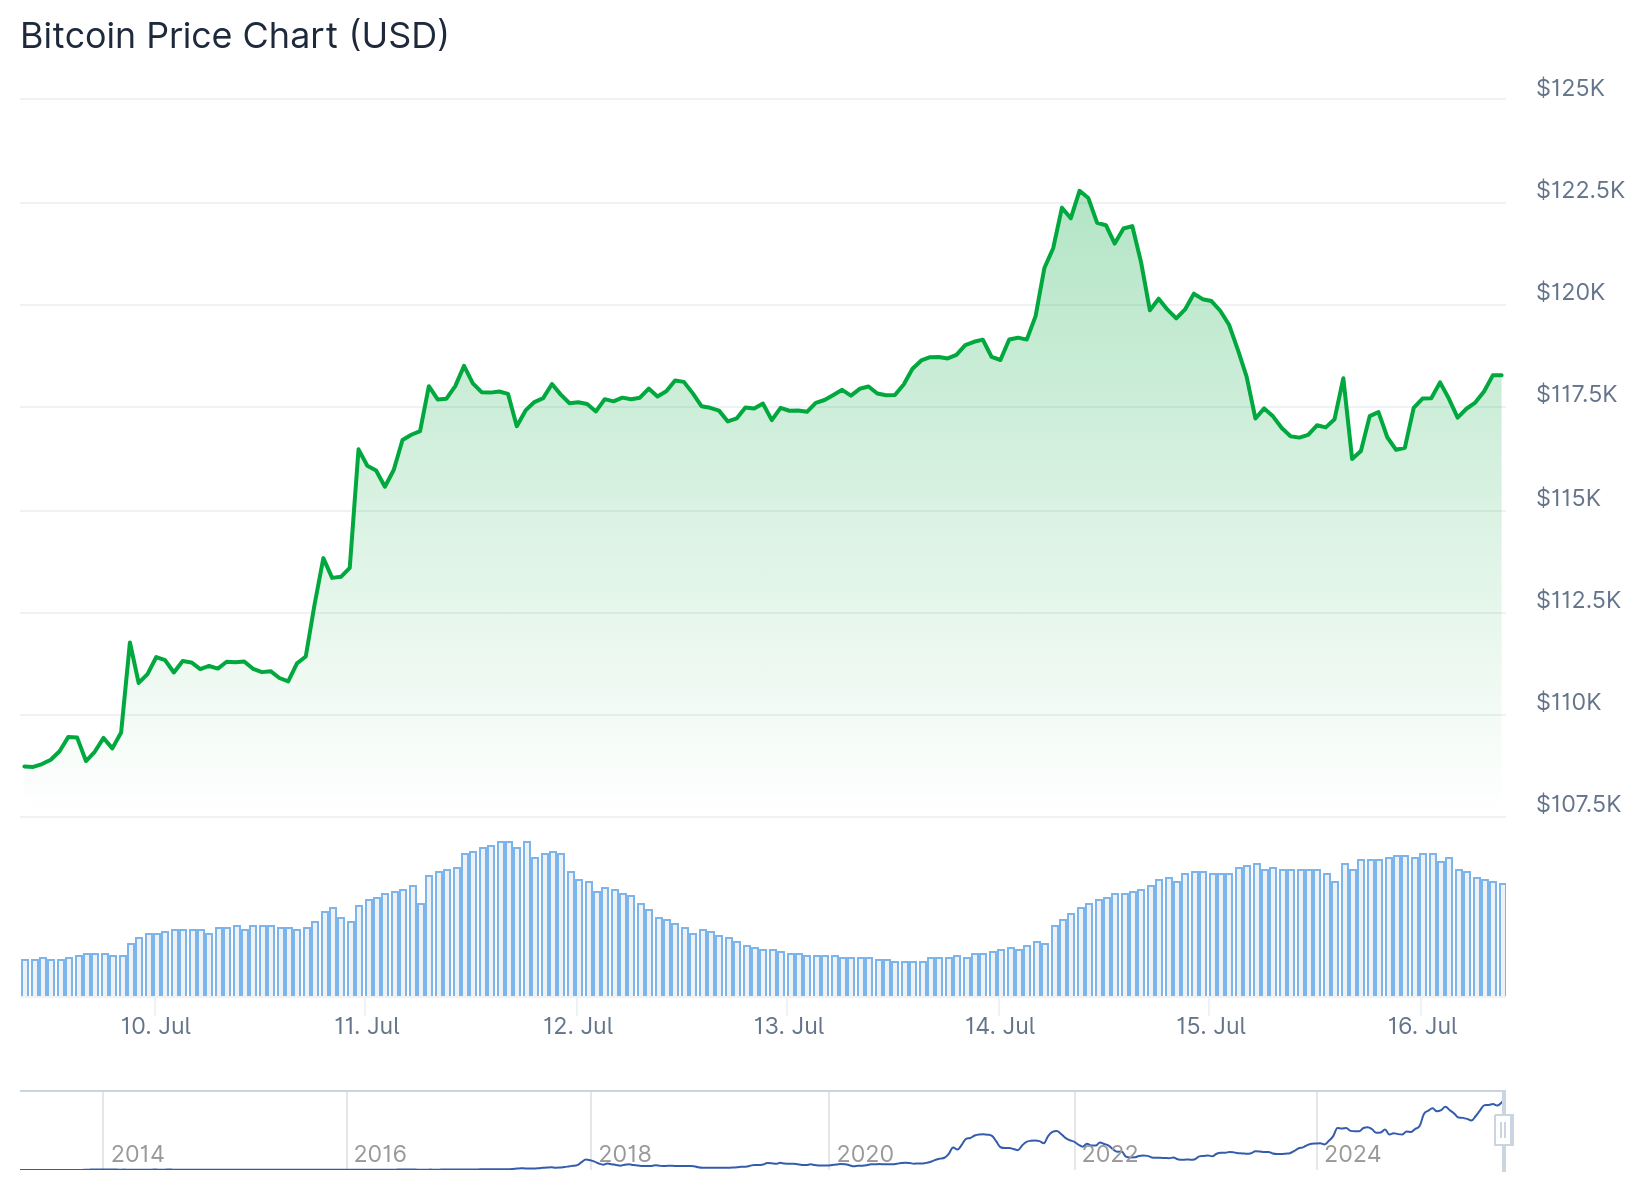
After reaching a new yearly high of $123,218, bitcoin retraced sharply to $116,500 on Tuesday. The move neutralized overleveraged positions and reset market sentiment. For bulls to regain control, Bitcoin needs to reclaim the $119,250 to $120,700 zone.
This area represents a sell-side imbalance where aggressive sellers previously pushed prices lower, leaving unfilled buy orders. A clean breakout above this range WOULD signal renewed bullish momentum and open the door for fresh highs beyond $123,000.
Support Zones and Downside Risks
A deeper correction appears more probable in the short term. Bitcoin could revisit the fair value gap between $113,700 and $115,300, aligned with the 200-day exponential moving average. This zone offers dynamic support and could provide a bounce point for continuation of the broader uptrend.

If selling pressure intensifies, Bitcoin may retest the former all-time high around $112,000 before resuming its upward trajectory. Technical indicators suggest the cryptocurrency is holding above key Fibonacci retracement levels, providing some support.
The next major resistance levels sit at $120,000 and $122,000. A close above $122,000 could send Bitcoin toward the $125,000 level, with a main target at $130,000. However, failure to break above $120,000 could trigger further downside toward $115,500 and $114,150.
Market participants are closely watching this week’s Producer Price Index data for additional clues about inflation trends. A softer PPI reading could help Bitcoin regain control above $120,000, while a hotter print might trigger another pullback between $115,000 and $110,000.
Bitcoin is currently trading below the 100-hourly simple moving average, with the hourly MACD losing pace in bearish territory and RSI below the 50 level.
