Cardano (ADA) Golden Cross Flashes: Smart Money Positions for Major Move

Golden Cross triggers on Cardano charts—traders scramble as technicals scream buy.
The Signal Everyone's Watching
When a short-term moving average vaults above a long-term one, it's not just a line crossing a line. It's a classic momentum shift—the Golden Cross. For ADA, that pattern just printed. It's flashing green for chartists, suggesting the recent grind might be gathering steam for a bigger run.
Follow the Smart Money?
Whispers of 'smart money' positioning always swirl around these signals. The theory goes that the big players—the funds and whales with real capital—see this technical confirmation as their cue. They're not betting on hype; they're betting on structure. Whether they're accumulating quietly or just preparing their exits is the eternal crypto question—after all, someone's 'smart trade' is always someone else's costly lesson in a market that treats retail investors like disposable napkins at a Wall Street banquet.
Beyond the Chart Lines
A bullish chart pattern doesn't exist in a vacuum. It needs fuel. For Cardano, that means watching network development, staking activity, and broader crypto sentiment. The Golden Cross might light the fuse, but ecosystem growth determines the bang.
The signal is live. Now we see if the market listens—or if this is just another beautifully drawn trap.
TLDR
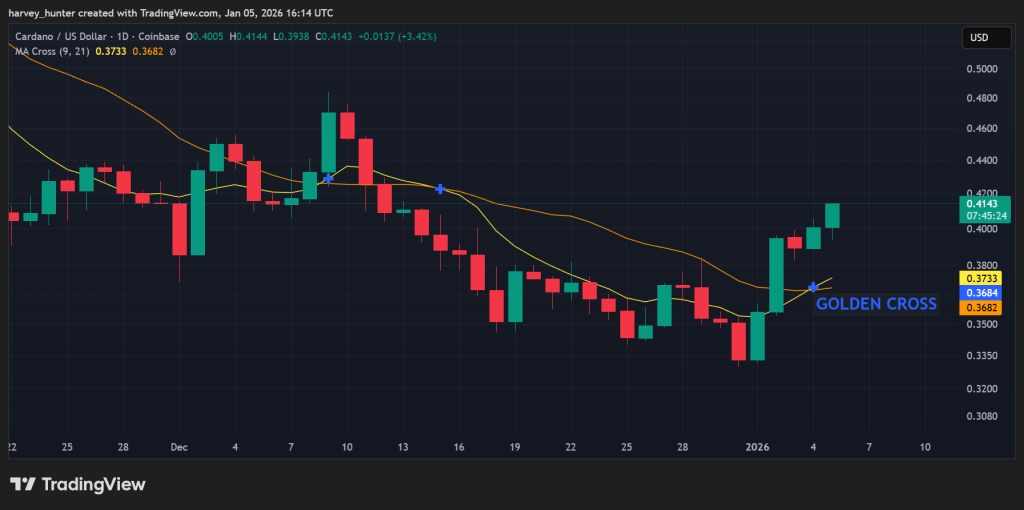
- Cardano (ADA) formed its first golden cross of 2026 on January 5, with the 9-day moving average crossing above the 21-day moving average
- Trading volume spiked 31.35% to $614.85 million in 24 hours, suggesting possible large holder activity
- Futures open interest reached $856 million, the highest level since October 10, indicating increased leverage trading
- The token rebounded 25% from its December 31 low of $0.3278 to around $0.4125
- Technical indicators point to a potential 25% rally toward the $0.51 resistance level
Cardano started 2026 with a golden cross pattern forming on its price charts. The technical indicator appeared when the 9-day moving average crossed above the 21-day moving average on January 5.
This pattern often signals a potential trend reversal for cryptocurrencies. However, an earlier golden cross in December proved short-lived.
The formation came with a 31.35% jump in 24-hour trading volume. Volume reached $614.85 million on the day of the cross.
Large trading volume spikes often indicate activity from major holders. This has led to speculation about institutional or whale accumulation.

Cardano price dropped to $0.3278 on December 31 before rebounding. The token now trades around $0.4125, marking a 25% recovery from that low point.
The rally matches broader market movements. Bitcoin moved above $92,000 while total crypto market capitalization exceeded $3.2 trillion.
Futures Market Shows Increased Activity
Futures open interest for Cardano climbed to $856 million. This marks the highest level since October 10.

Open interest had bottomed at $603 million on December 19. The metric has been rising steadily since then.
Rising open interest suggests traders are using more leverage to buy the token. The funding rate also turned positive during this period.
A positive funding rate means long position holders are paying short position holders. This typically indicates bullish sentiment among futures traders.
The Relative Strength Index moved above 50 on the daily chart. This level represents the neutral point between bullish and bearish momentum.
The RSI reached 57, a level not seen since September. That was before market conditions shifted to extreme fear.
Technical Targets and Resistance Levels
The MACD indicator shows the signal line maintaining distance above the baseline. This configuration suggests buyers currently control the trend direction.
$ADA Falling Wedge Upside breakout has been Confirmed & Retest is Process in daily Timeframe..
Expecting Massive bullish Rally![]() #ADAUSDT #ADA #Crypto pic.twitter.com/Ft5Gp37xvO
#ADAUSDT #ADA #Crypto pic.twitter.com/Ft5Gp37xvO
— Clifton Fx (@clifton_ideas) January 5, 2026
Cardano trades within a year-long descending channel pattern. The token has bounced from the lower boundary of this channel multiple times.
The key resistance level sits at $0.70. Breaking above this price could trigger a larger MOVE upward.
Some analysts project a potential 225% rally if that breakout occurs. That WOULD take the price toward cycle highs around $1.35.
Previous cycle highs reached approximately $2. Reaching that level would represent a 635% gain from current prices.
The token remains below its 50-day and 100-day Exponential Moving Averages. It also trades under the Supertrend indicator.
Most technical analysts view these as bearish signals in the short term. The immediate price target sits at $0.51, representing a 25% move from current levels.
This target aligns with resistance levels from February, April, and June of last year. cardano last traded at this level on December 12.
The Midnight mainnet launch is scheduled for later this quarter. The Leios upgrade is also planned for later in 2026.
