XRP Price Prediction: Ripple Token Primed for $4.70 Rally as Breakout Signals Flash

Breakout patterns are converging, pointing Ripple's XRP toward a potential surge that could redefine its market position.
The Technical Setup
Charts aren't just squiggly lines—they're a battle map. For XRP, a decisive breakout above a key resistance level has analysts whispering about a trajectory not seen in years. The pattern suggests momentum is building, not from hype, but from a classic technical formation that often precedes significant moves. It's the market's version of a coiled spring.
The $4.70 Target: More Than a Number
That $4.70 figure isn't plucked from thin air; it's derived from the measured move of the current pattern. Hitting it would represent a monumental rally, a move that would silence a chorus of skeptics and likely trigger a fresh wave of institutional glances toward the digital asset. Of course, in crypto, a 'target' is just a polite suggestion until price actually respects it—something traditional finance often forgets when it dabbled in this space and got burned.
The Road Ahead
All eyes are on volume. A breakout without it is just a false alarm, a head fake for retail traders. Sustained buying pressure needs to confirm the move, turning resistance into a new foundation for growth. If it holds, the path clears for a run that could capture the market's attention and, perhaps, finally deliver on the long-held potential that has surrounded Ripple's token. The signal is flashing; now we see if the market has the fuel to follow it.
TLDR
- XRP holds key support within a descending channel as volatility contracts
- Bullish RSI divergence signals weakening bearish momentum
- Descending triangle nears completion, setting up a potential breakout
- Exchange outflows suggest steady accumulation and reduced sell pressure
XRP price is consolidating NEAR key support levels as technical, momentum, and on-chain indicators begin to align. Analysts noted contracting volatility, weakening bearish momentum, and steady accumulation beneath the surface. Together, these signals suggest the market may be approaching a decisive phase, with upside targets emerging if resistance levels are reclaimed.
XRP Price Holds Descending Channel as Support Stays Firm
According to analyst CRYPTOWZRD, the daily chart shows xrp price consolidating within a descending channel that has guided structure through much of 2025. While lower highs remain capped by the channel’s upper trendline, higher lows near the $1.80–$2.00 zone continue to hold. This structure limits downside extension and keeps the broader setup constructive despite ongoing consolidation.
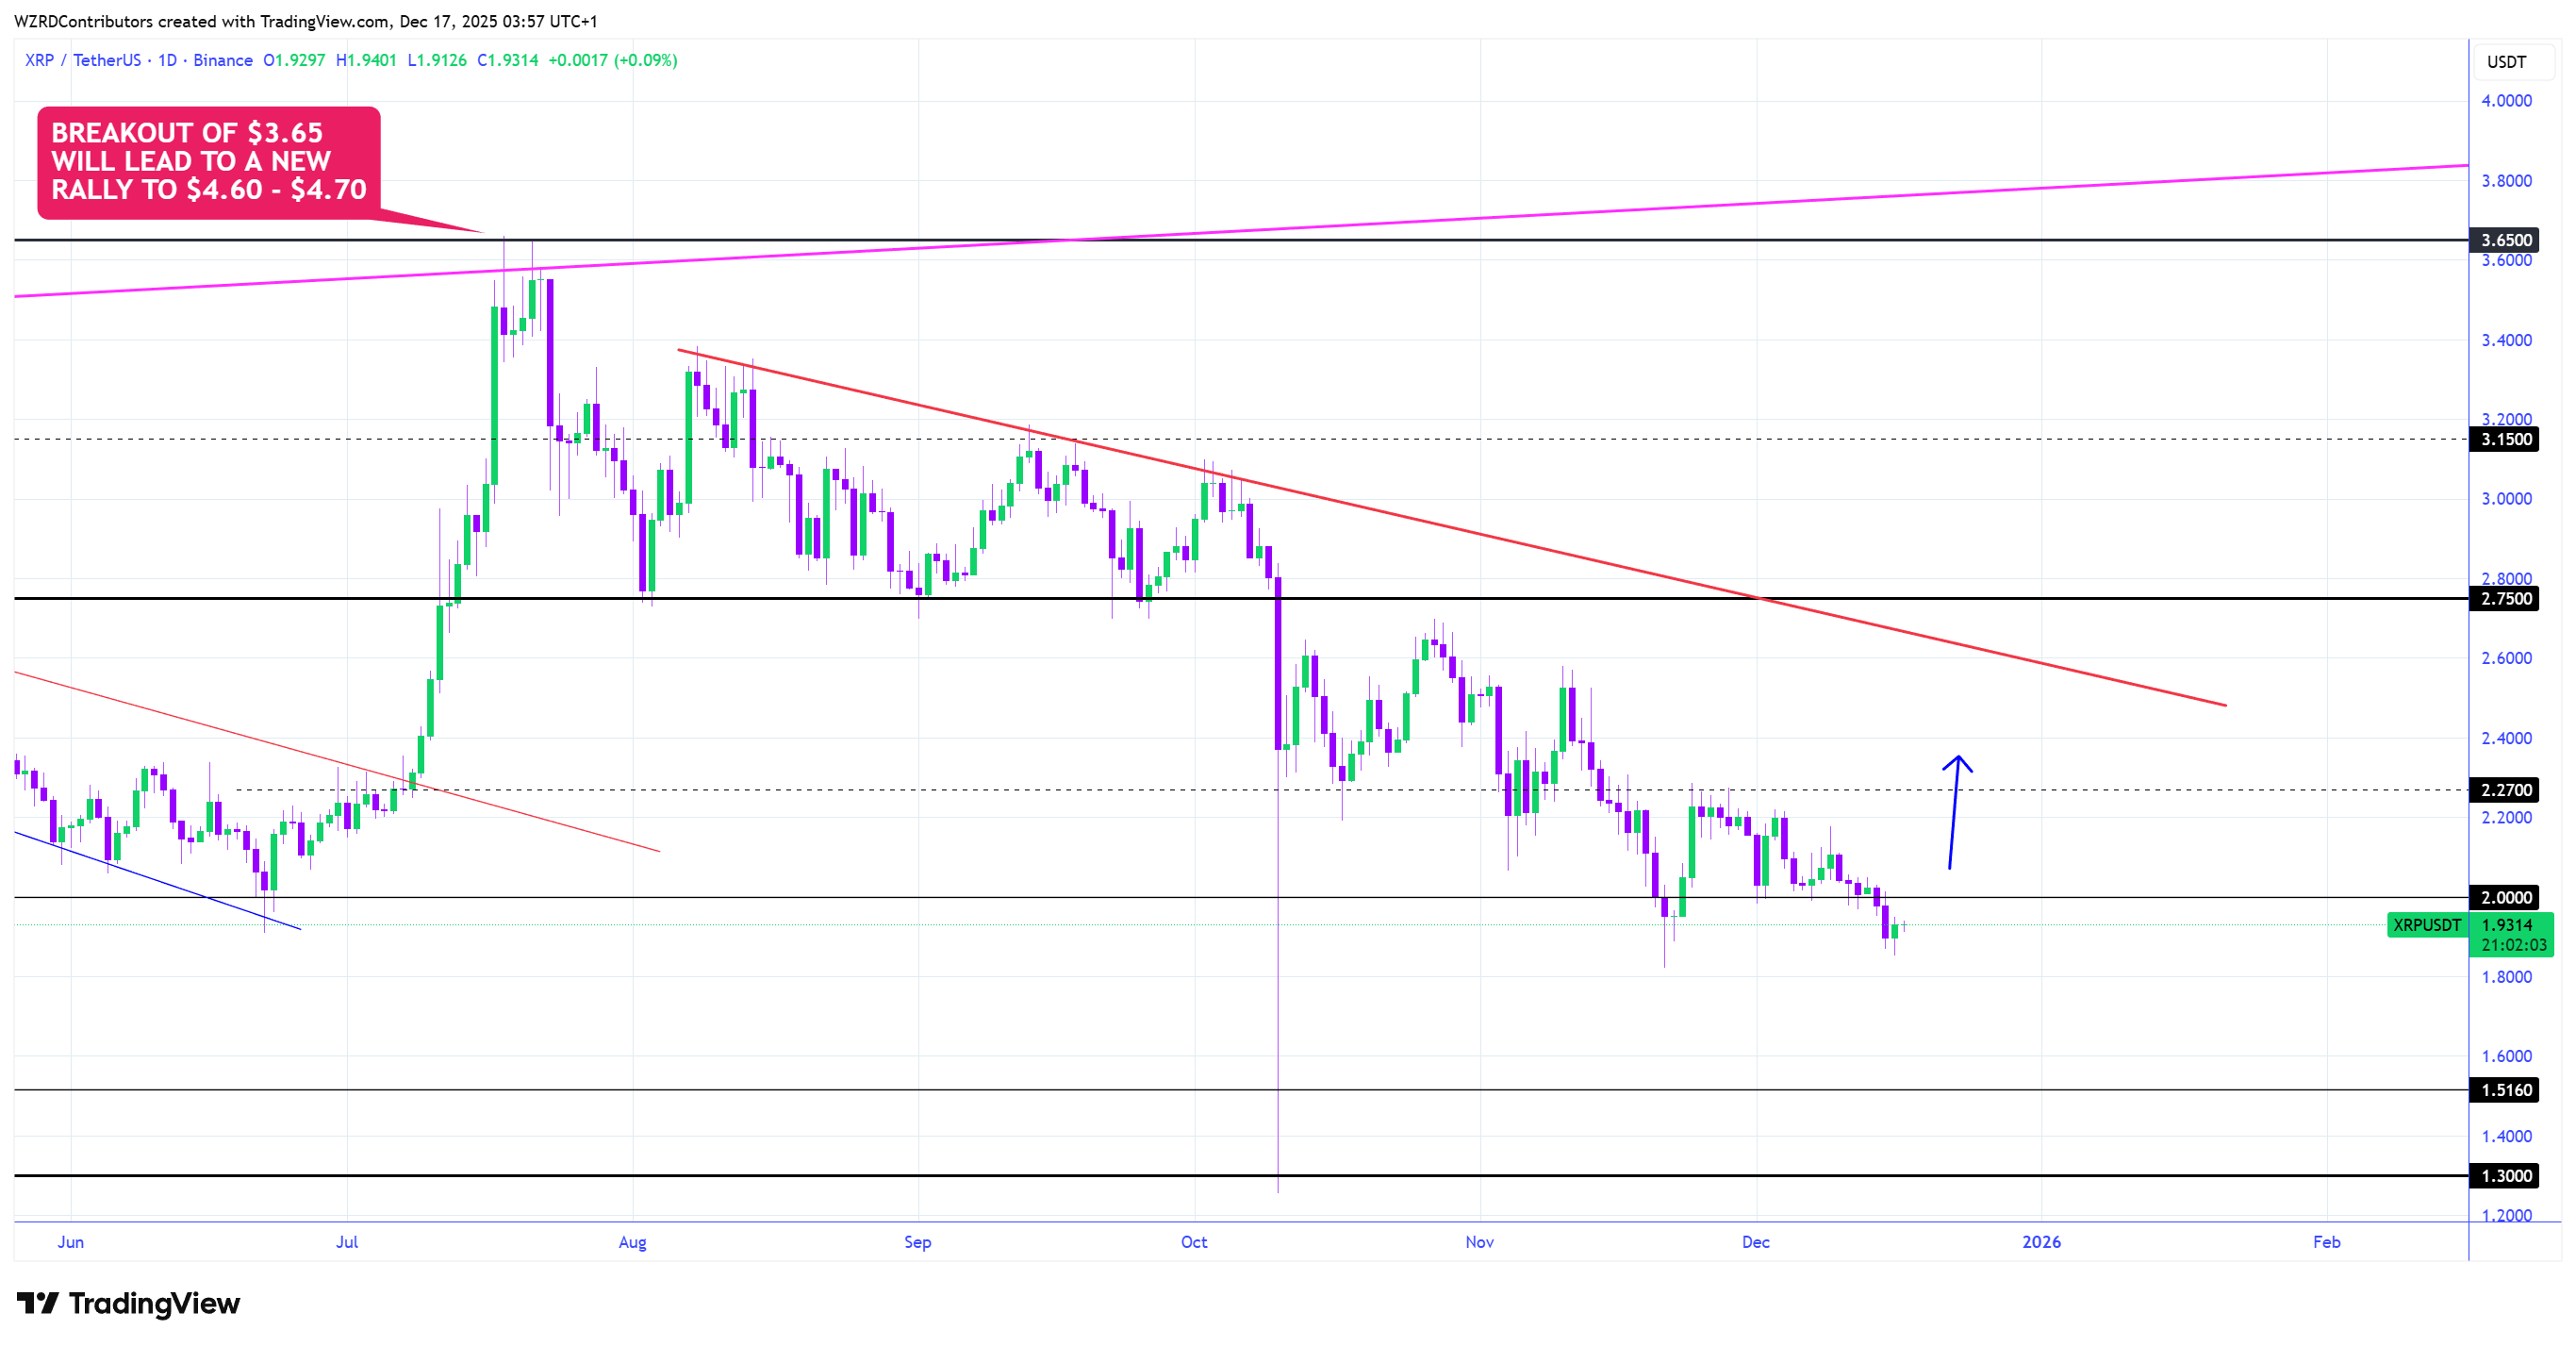
Additionally, the most recent test of channel support was followed by a mild bullish close and reduced volatility. More so, volume data suggests that sell-side pressure is thinning near current levels, which often aligns with accumulation behavior. The analyst noted that a sustained move above $2.10 could shift short-term momentum and open a path toward the channel midline. A breakout WOULD place the $3.65 resistance level into focus, with extensions toward the $4.60–$4.70 level if momentum accelerates.
Descending Triangle Nears Completion
Meanwhile, analyst ChartNerd highlighted a separate technical development tied to a larger descending triangle formation. Price action has been working through an unfilled wick from October, a move commonly seen before trend transitions. As XRP price approaches the triangle’s measured breakdown target, bearish momentum appears to be weakening rather than expanding.
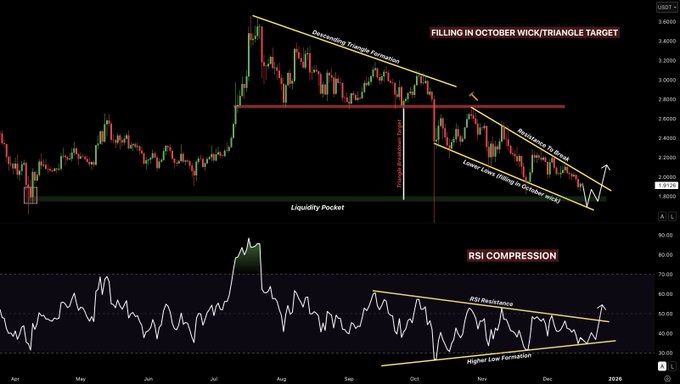
In addition, momentum indicators show a clear bullish divergence. While price has printed lower lows, the RSI has formed higher lows, signaling improving internal strength. Compression in the RSI further suggests that directional energy is building. ChartNerd suggested a final liquidity sweep below current levels to complete the structure, followed by a relief bounce. Initial recovery targets sit near $2.80, aligned with triangle resistance, with higher levels possible if broader market conditions support continuation.
Exchange Outflows Point to XRP Price Accumulation
On-chain data from Coinglass analysts adds another LAYER to the outlook. The XRP spot inflow and outflow chart shows persistent net outflows from exchanges throughout 2025. This trend indicates that tokens are being moved into self-custody, reducing immediately available supply on centralized platforms.
SOURCE: Coinglass
Moreover, periods of intensified outflows have coincided with local price stabilization, reinforcing the accumulation narrative. While brief inflow spikes have occurred, they were typically absorbed quickly and followed by price recovery. Sustained negative netflows often precede supply constraints during rallies, as fewer tokens remain available for sale. This behavior supports the technical view that selling pressure is diminishing, even as price trades below major resistance.
Combined, chart structure, momentum signals, and on-chain flows suggest XRP price is nearing an inflection point. The market remains range-bound in the short term, but underlying conditions point to improving risk-reward dynamics. A confirmed MOVE above near-term resistance could validate the breakout thesis, while continued support holding would keep the broader upside scenario intact as traders watch for directional confirmation.
