Chainlink (LINK) at $16: The Ultimate Buying Opportunity You Can’t Afford to Miss

Oracle Network Flashes Rare Discount Signal
Chainlink's current price action screams opportunity for savvy investors. The $16 level represents a critical support zone that historically precedes major rallies.
Technical Foundations Strengthen
Market data reveals institutional accumulation patterns emerging at these levels. The oracle network's real-world adoption continues expanding while retail sentiment remains surprisingly muted.
DeFi's Backbone Gets a Discount
With over 1,700 integrations and counting, Chainlink's utility transcends speculative trading. The network processes billions in value daily—making current valuations appear disconnected from actual usage metrics.
Timing the Bottom
Historical patterns suggest these levels rarely last more than a few weeks before explosive moves upward. Traditional finance might still be debating blockchain's merits, but smart money already positioned itself.
Sometimes the best trades feel uncomfortable—especially when Wall Street analysts are busy downgrading stocks over earnings misses of 2%.
TLDR
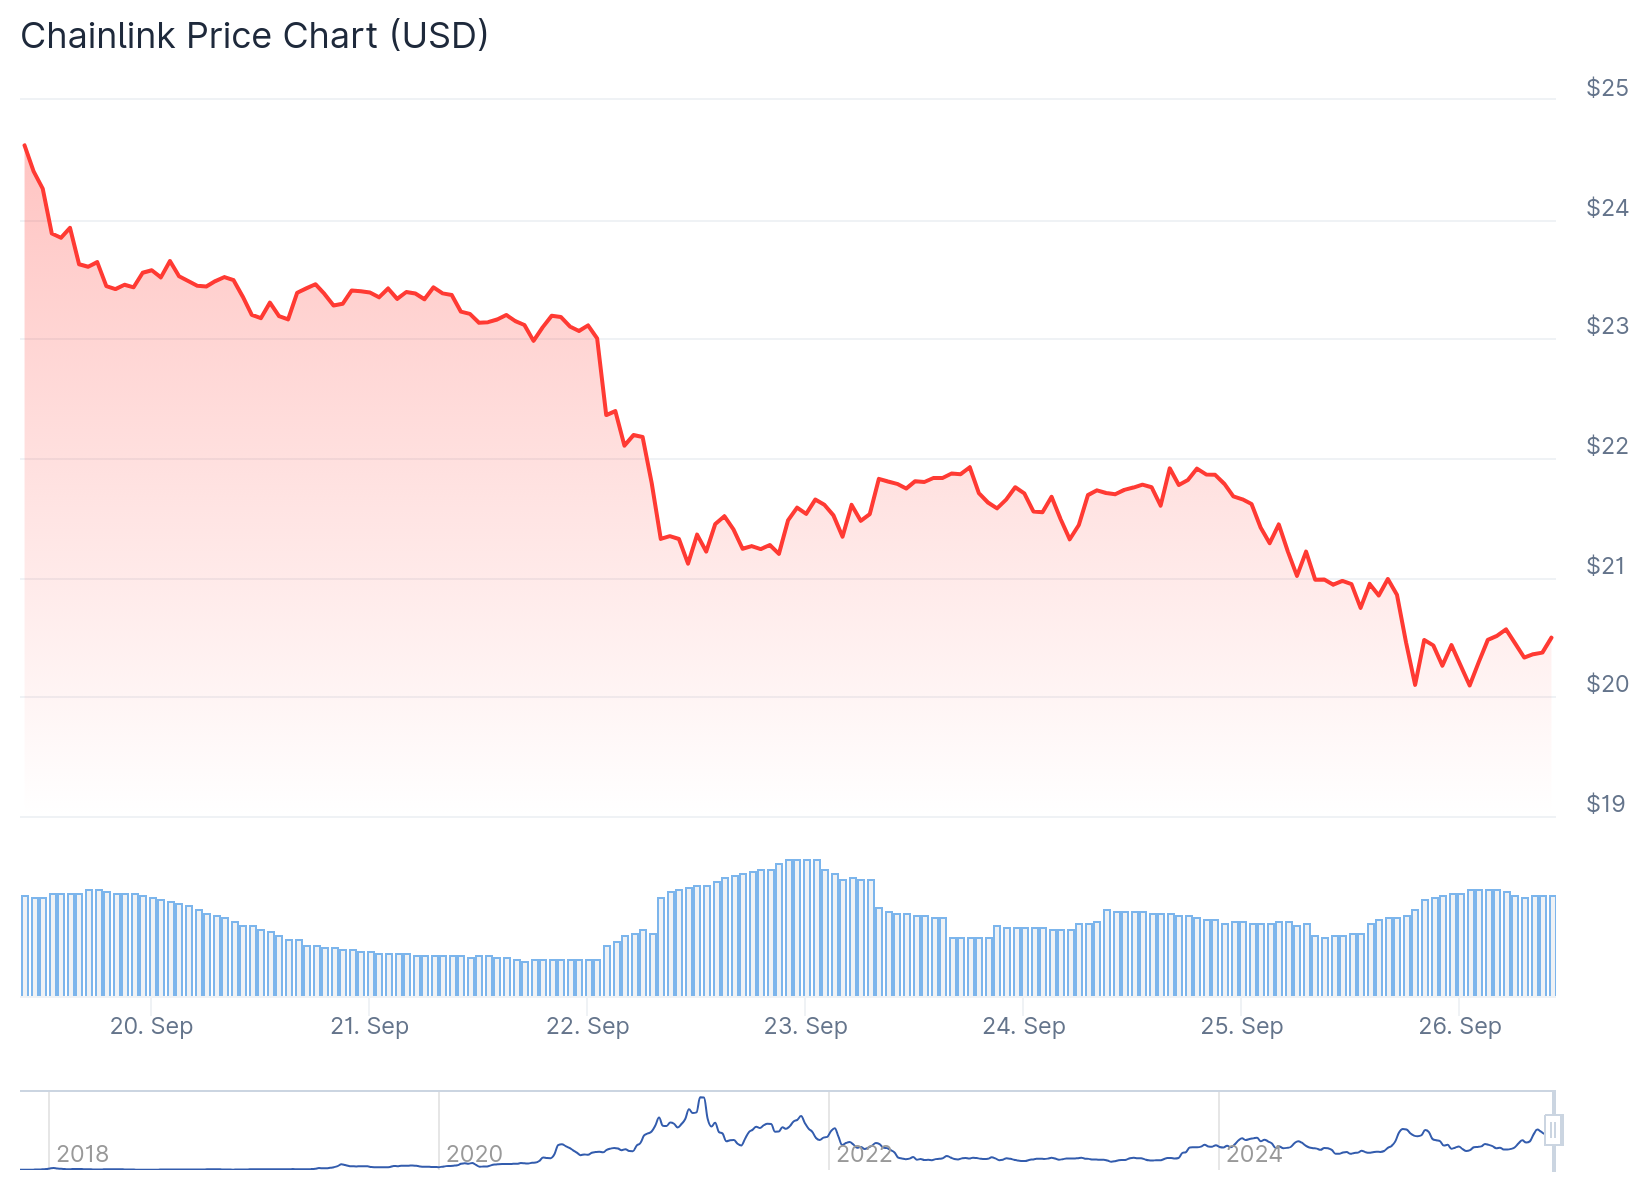
- Chainlink is trading around $21.77, facing resistance at $22.00 after recent declines
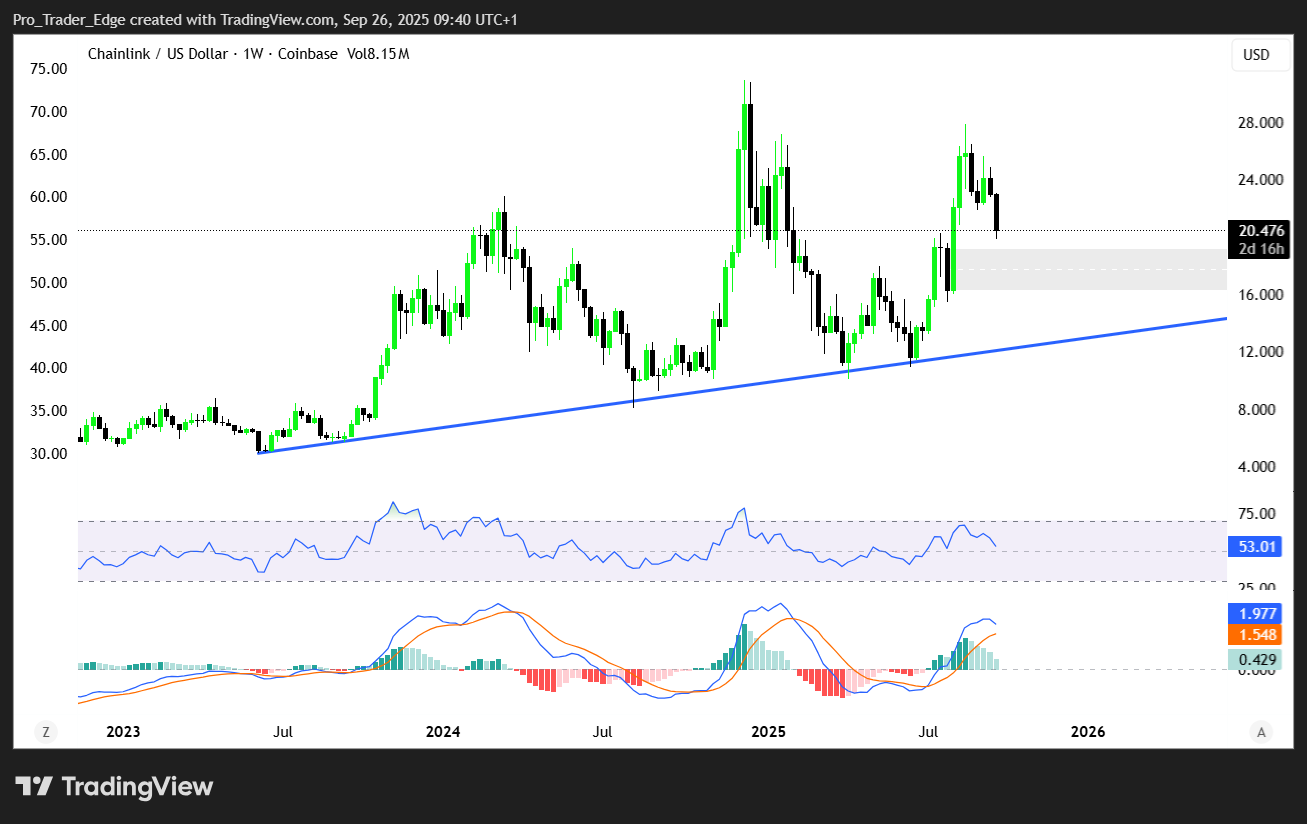
- A triangle pattern has formed over several years with potential breakout targeting $100
- Analyst suggests a dip to $16 (0.5 Fibonacci level) would be a buying opportunity
- Long-term red diagonal resistance from 2021 peak continues to limit upside moves
- Daily trading volume remains strong at $839 million despite 1.35% daily loss
Chainlink is currently trading around $21.77, with the cryptocurrency facing a critical test at the $22.00 resistance level. The digital asset has experienced steady declines in recent trading sessions, putting key support levels under scrutiny.
Analyst Ali Martinez has identified a triangle pattern forming in Chainlink’s weekly price chart over the past few years. This consolidation pattern sits somewhere between a symmetrical triangle and an ascending triangle, with both trendlines creating converging boundaries.
A dip to $16 on chainlink $LINK would be a gift. This triangle breakout setup targets $100! pic.twitter.com/s69oqbMniB
— Ali (@ali_charts) September 25, 2025
The triangle pattern shows LINK has been coiling within these boundaries, with the upper trendline acting as resistance and the lower one providing support. Earlier this year, Chainlink retested the upper boundary of this pattern but found rejection at that level.
Martinez believes that a potential dip to $16 WOULD present a buying opportunity. This price level corresponds to the 0.5 Fibonacci retracement level, which has historically served as a key support area for the cryptocurrency.
The analyst’s chart analysis suggests that if Chainlink bounces from the $16 level, it could lead to a breakout from the triangle pattern. Such a breakout could potentially target the 1.272 Fibonacci extension level, which translates to nearly $100 in price terms.
Current Market Dynamics
Trading volume has remained robust at approximately $839 million, indicating sustained market interest despite recent price weakness. The strong volume suggests that the current price action is not occurring in a thin liquidity environment.
Crypto analyst crypto Monkey noted that the $22.00 level is acting as a crucial pivot point. A rejection at this resistance could create a short trade opportunity toward the $20.00 area, which represents an important demand zone.
$LINK
$22.00 is being tested now. If we reject then that opens a short for me down to the lows. If we get over as support then i will long. So either way here guys we have a play pic.twitter.com/iKBXA5wP2W
— Crypto Monkey (@LaCryptoMonkey) September 24, 2025
Conversely, a confirmed breakout and close above $22.00 could attract fresh buying interest. This would potentially open the path toward the $26.00 level as the next upside target.
The daily chart shows that LINK opened NEAR $21.60 and briefly moved above $21.80 before encountering selling pressure. The price retreated to $21.37 by the session’s end, marking a 1.35% daily decline.
Long-Term Technical Resistance
MarketMaestro has highlighted a long-term red diagonal resistance line on the monthly chart that continues to limit Chainlink’s upside potential. This trendline has blocked several breakout attempts since the 2021 peak, reinforcing its significance as a technical barrier.
The recent rejection at this diagonal resistance demonstrates that selling pressure remains active at higher price levels. This keeps immediate support areas under pressure as the market tests lower boundaries.
Key support levels have been identified around $14, $17, $21, and $25 as potential demand zones if selling pressure continues. Maintaining strength above these levels is essential to prevent deeper pullbacks.
The $21.30 to $21.40 area now serves as immediate support following the recent price action. A break below this range could lead to further retracements if buying interest continues to fade.
Despite current headwinds, the $31 zone remains the next major target if bullish conditions return. A decisive monthly close above the red diagonal resistance could shift market sentiment and enable a MOVE toward higher Fibonacci extensions.
Chainlink maintains its position as the 13th largest cryptocurrency by market capitalization at approximately $14.48 billion. The circulating supply stands at nearly 678 million tokens.
