Dogecoin (DOGE) Price: Triangle Formation Signals Explosive Move Imminent

Dogecoin's technical setup screams volatility as symmetrical triangle reaches breaking point.
Technical Breakdown
The DOGE chart paints a classic consolidation pattern—price action tightening between converging trendlines like a spring coiling before release. Volume drying up suggests traders are holding their breath waiting for the breakout.
Market Implications
Triangle formations typically precede significant price movements. When this one snaps, we're looking at a potential 40-60% swing based on the pattern's measured move projection. The crypto market's favorite meme coin could either rocket toward yearly highs or retest critical support levels.
Trader Sentiment Diverges
Options flow shows bulls loading up on cheap calls while institutional money remains skeptical—typical Wall Street behavior of being late to the meme party. Retail traders continue accumulating at key levels, betting on another Elon Musk tweet catalyzing the upward breakout.
Regulatory Wildcard
SEC chair comments about 'meme asset classification' loom over the technical picture. Because nothing says serious financial regulation like debating whether a cryptocurrency born from a dog joke deserves its own trading desk.
Bottom Line: Prepare for liftoff or breakdown within 5-7 trading days as this pattern resolves. The dog might finally have its day—or get sent back to the pound.
TLDR
- Dogecoin (DOGE) is holding critical support at $0.22, which aligns with the 0.618 Fibonacci retracement level
- The cryptocurrency is forming an ascending triangle pattern since July with resistance target near $0.29
- Analysts predict potential 800% rally to $1.30 if DOGE maintains support above $0.14
- Price has been rejected three times at $0.24 resistance level with additional barriers at $0.27-$0.28
- Current trading price around $0.222 as DOGE attempts to halt its recent 22% weekly decline
Dogecoin finds itself at a pivotal moment as the meme coin tests crucial support levels near $0.22. The cryptocurrency has declined 22% this week according to CoinGecko data.
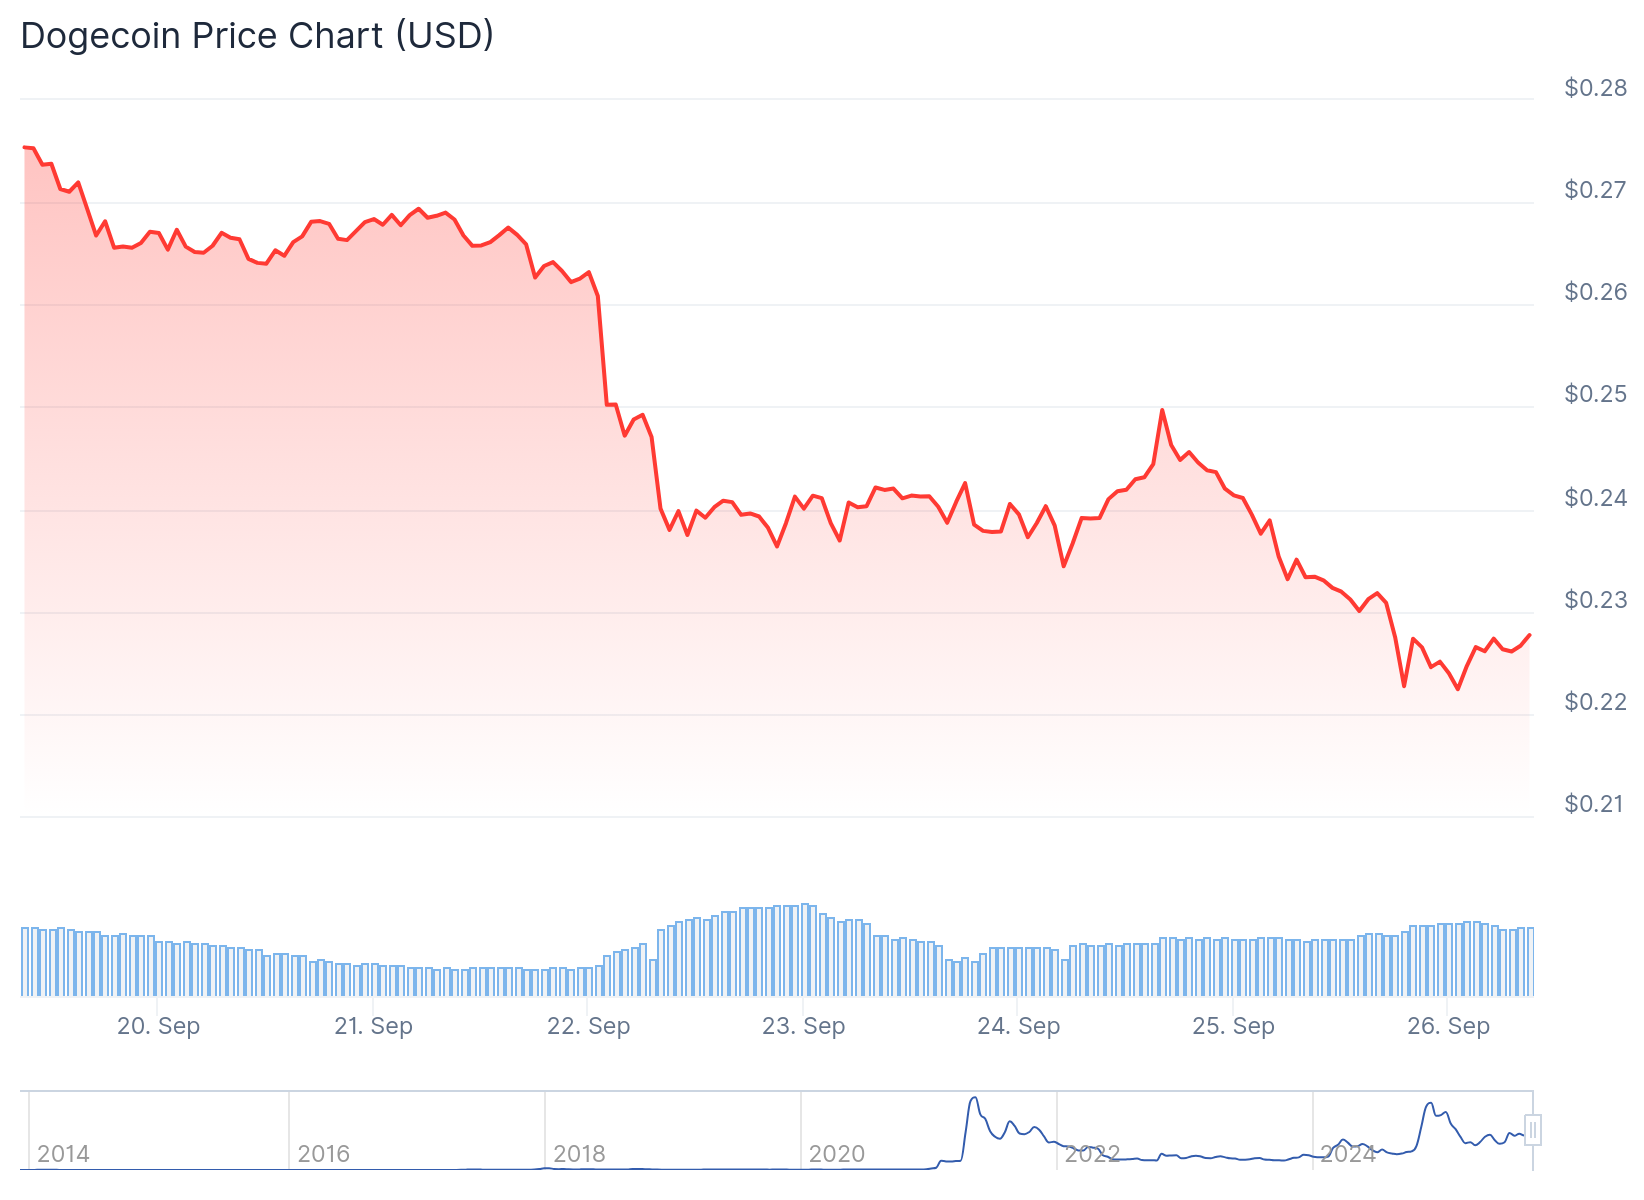
The current price action sits nearly 70% below Dogecoin’s all-time high of $0.73. Despite recent weakness, technical analysis suggests the token remains positioned for potential upside movement.
Chart analysis reveals an ascending triangle pattern that has been developing since July. This formation shows price testing the $0.22 support zone, which coincides with the 0.618 Fibonacci retracement level at $0.2288.
The triangle structure indicates potential consolidation between $0.24 and $0.29 before any breakout occurs. Maintaining current support levels could trigger momentum toward the triangle’s apex NEAR $0.29.
Dogecoin $DOGE must hold $0.22 for a potential rebound to the triangle's x-axis at $0.29! pic.twitter.com/ZhgcCMAjue
— Ali (@ali_charts) September 26, 2025
Price has faced rejection at $0.24 on three separate occasions. Additional resistance levels appear at $0.27 and $0.28 that need clearing for sustained recovery.
Key Technical Levels
Support zones include the current $0.22 level, with deeper levels at $0.21, $0.19, and $0.16. These areas have historically provided bounce points for the token.
The critical $0.14 level represents major trendline support on the weekly chart. Analysts suggest this threshold remains key for maintaining bullish structure.
If upside momentum builds, initial targets include $0.30-$0.32. Extended projections reach $0.38 and $0.42 based on the triangle pattern.
Some analysts forecast more ambitious targets, with projections as high as $1.30 representing potential 800% gains from current levels.
$DOGE Setting Up for Next Explosive Move? 🐶🚀
Dogecoin follows a repeating structure:
📈 300% ➡️ 500% ➡️ now targeting 800% rally
🔍 Price bouncing off ascending trendline support
🎯 Target = ~$1.30 if pattern repeats again!
History rhyming or just hype?#DOGE #Crypto pic.twitter.com/7YqF4YMQa0
— Bitcoinsensus (@Bitcoinsensus) September 24, 2025
Market Context and Performance
Recent economic data shows weekly jobless claims decreased to 218,000 for the week ending September 20. This figure came in below expectations, indicating labor market resilience.
The US Commerce Department revised second-quarter GDP estimates upward to 3.8%. This reflects strong consumer spending and represents the strongest quarterly growth in over two years.
Such economic indicators could influence cryptocurrency rotation as investors MOVE between traditional and digital assets.
The ascending trendline support currently sits at $0.14 on weekly charts. Historical patterns show similar setups have led to rallies of 300% and 500% in previous cycles.
These comparisons reference price movements between September and November of last year. Current corrections below $0.20 have not violated the major support structure.
At the time of analysis, Doge trades around $0.222 as it attempts to stabilize from recent declines. The token needs to hold above $0.22 to validate the ascending triangle scenario.
