Gold & Bitcoin Stage Comeback: 78.6% Fibonacci Retracement in Play

Markets roar back as gold and Bitcoin test key technical threshold—proving once again that fear and greed move faster than Fed statements.
The Fibonacci showdown
Both assets are flirting with the 78.6% retracement level, a make-or-break zone that separates relief rallies from legitimate trend reversals. No fancy indicators needed—just pure price action warfare.
Gold''s old-school resilience
The yellow metal''s bouncing like it''s 2008 again, while Bitcoin mimics its moves with crypto''s signature volatility. Who needs correlation coefficients when you''ve got parallel price drama?
Wall Street''s watching
Traders are glued to charts, knowing this level could trigger algorithmic avalanches. Meanwhile, fundamental analysts pretend they saw this coming all along—classic Monday morning quarterbacking.
One thing''s certain: whether it''s digital gold or the real thing, markets are screaming that inflation hedges are back in vogue. Just don''t tell the ''this time it''s different'' crowd.
Fibonacci Retracement Signals Shift for Gold, Bitcoin, and Crypto
The recent price action demonstrates how gold and Bitcoin react at these crucial Fibonacci retracement levels. Gold’s rally ended precisely at the 78.6% target, which also coincided with an important Gann square at $3,446.20. This confluence created significant resistance for the precious metal, and traders are watching closely right now.
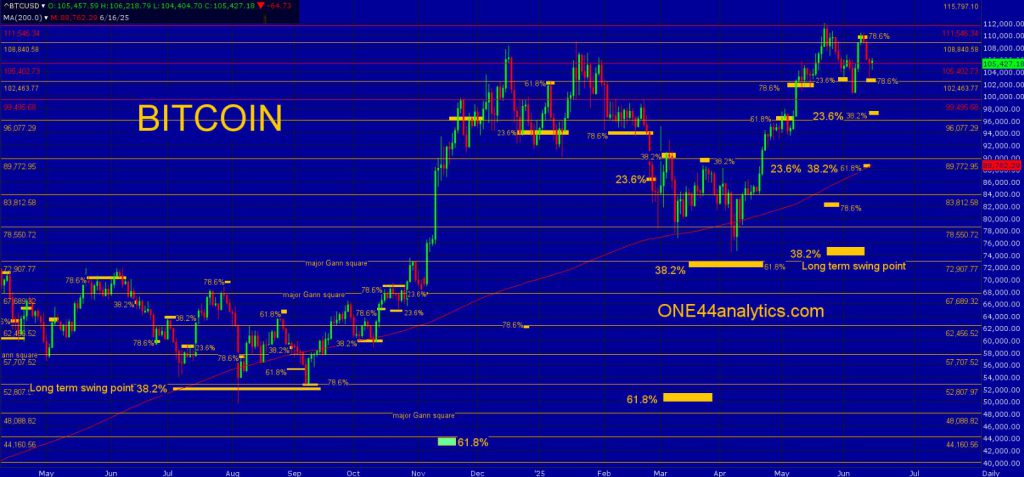
Bitcoin hit the 78.6% retracement back to its all-time high at $109,500 before experiencing an abrupt reversal. Following the technical analysis rules, bitcoin then declined to approximately $102,900, establishing this level as the key support for the cryptocurrency market. At the time of writing, both gold and Bitcoin remain near these critical zones, and the movements continue to unfold.
Market Analysis and Price Targets
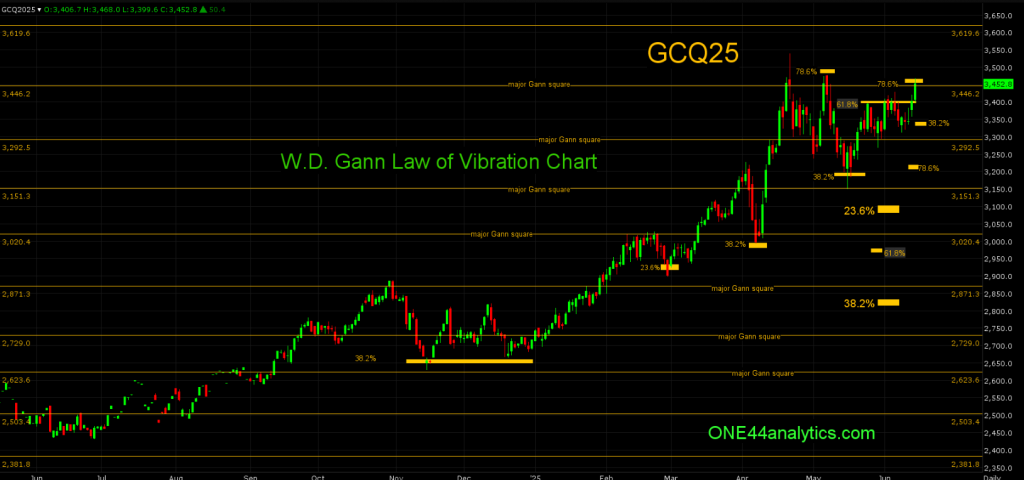
For Gold and Bitcoin, the current technical setup suggests some critical levels ahead right now. Gold’s $3,453.30 resistance remains the primary level to watch, while Bitcoin’s $102,900 support zone determines the future direction for cryptocurrency markets and also broader digital asset sentiment.
The inability of gold and Bitcoin to decisively cross above their respective 78.6% Fibonacci retracement levels suggests the possibilities of weakening trend. Immediate short term Bitcoin targets are at $97,550 that marks a crucial 38.2 percent retracement whereas gold may approach a price of $3,195 in case the present resistance is maintained and the selling pressure persists.
Such developments have been coming at a time when there is a continuous countdown on Bitcoin halving as well as the United States dollar volatility. The two drivers still do affect the attitude sentiment of cryptocurrencies and the pricing of precious metals in the world markets. In addition, Bitcoin halving now complicates the current market dynamics in the cryptocurrency sphere.
The strength of United States dollar is also very vital in the performance of both gold and Bitcoin in these Fibonacci retracement levels. As it stands, the two assets are experiencing headwinds as far as a dollar movement is concerned, as well as the wider market Uncertainty.
These Fibonacci retracement levels are used as the point of decisions by traders as well as investors that are tracking both the conventional and the digital assets in the newly existing market setup.
