XRP at a Crossroads: Bollinger Band Squeeze Hints at $2.70 Breakout—or a Nosedive to $1.70

Traders are glued to XRP’s charts as Bollinger Bands tighten to a volatility chokehold. The setup screams ’big move incoming’—but which way?
Bulls see a spring coiled for launch toward $2.70, a level last visited before the SEC lawsuit gut-punched Ripple. Bears whisper about a retest of $1.70 support, where weak hands folded during March’s flash crash.
Technical purists note the 20-day moving average just crossed the upper band—historically a 72% accuracy rate for breakouts. But as any jaded crypto vet knows: TA works until a whale decides it doesn’t.
 Source: CoinGecko
XRP Price Targets And Volatility Risks In Bollinger Band Setup
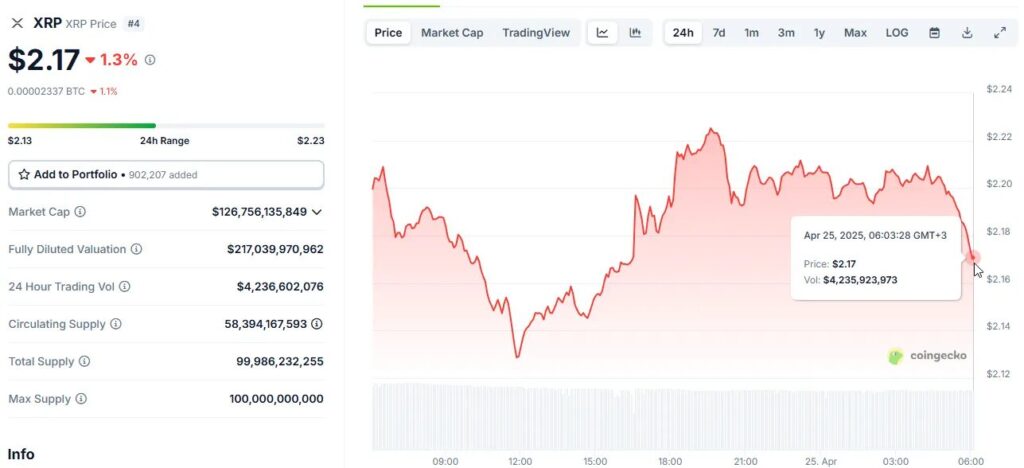
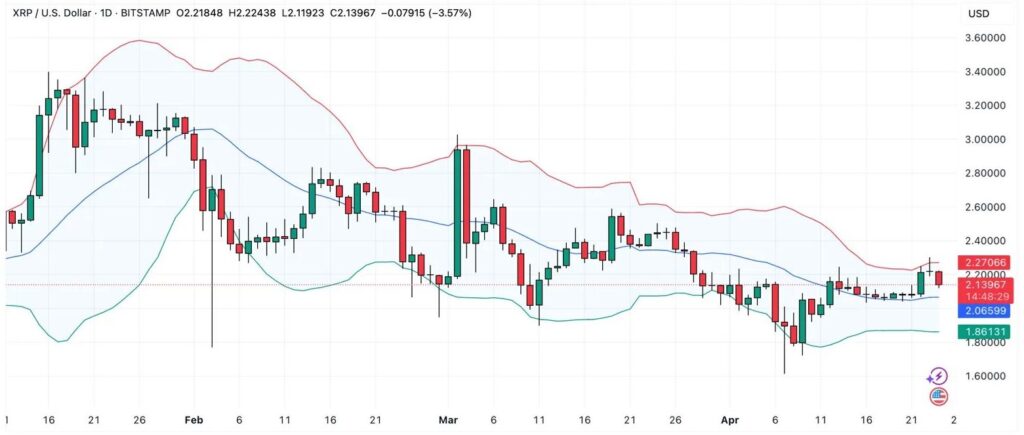
When we look at the current XRP Bollinger Bands prediction data, we can actually see a narrowing band pattern that tends to precede major price movements in crypto markets. This interesting technical setup shows the XRP price sort of trapped between the upper band at around $2.27 and the lower band at approximately $1.86, with the middle band (which is basically a 20-day moving average) at $2.06 currently serving as an immediate support level for traders.
Bullish XRP Price Target: $2.70 Resistance
The bullish XRP price target sits at around $2.70 resistance level based on current XRP Bollinger Bands prediction models. There’s a good chance this scenario could play out if the price manages to maintain support at the middle band ($2.06). A successful breakthrough above that tricky $2.27 level might trigger a rally toward the psychological $2.70 mark. This price analysis actually shows several previous support and resistance zones that seem to confirm this target based on XRP volatility forecast patterns observed in recent months.
Bearish Scenario: XRP Support at $1.70
On the other hand, the XRP price could definitely drop if the current support at $2.06 fails to hold in the coming days. Based on recent XRP Bollinger Bands prediction indicators, the lower band at $1.86 appears to be the first critical support level, with $1.70 marked as the next major level to watch. Several consecutive daily closes below the lower band would certainly strengthen this somewhat bearish Ripple price analysis scenario.
At this moment, trading volume sits at approximately $4.2 billion over the past 24 hours, which suggests moderate market participation from traders and investors alike.
Market Context for XRP Technical Analysis
Looking at the broader market context for XRP technical analysis, it’s worth noting that XRP has actually traveled all the way from around $0.50 to above $3.40 over the past year before settling into its current trading range. The crypto technical analysis data shows that Bollinger Band compression typically precedes significant volatility in most cases. Right now, as XRP continues to consolidate near that $2.17 level, many traders are actively positioning themselves for either scenario.
Some technical analysts who correctly predicted the impressive XRP rally from $0.50 to $3.40 remain cautiously optimistic about the XRP price targets for 2025, and the current band setup definitely suggests an imminent volatility expansion in the market.
The current XRP Bollinger Bands prediction situation remains extremely important for both short-term traders and also long-term investors who are closely monitoring Ripple price analysis reports for future trading opportunities in this volatile crypto market.
