XRP’s Final Dip: The Critical Level Needed Before Soaring to New All-Time Highs

XRP needs one last shakeout before the real party starts. Forget the moon—this digital asset is plotting a course for uncharted territory, but the launchpad requires a specific, lower price point first.
The Setup Before the Surge
Markets don't rocket upward in a straight line. They coil. They test support. They flush out weak hands. For XRP to muster the explosive energy required for a genuine breakout to new all-time highs, analysts point to a necessary, if painful, retracement. The logic is cold, technical, and brutally simple: sustainable rallies are built on solid foundations, not shaky, overbought ledges.
Finding the Floor
The magic number isn't pulled from thin air. It's derived from key Fibonacci retracement levels, historical volume profiles, and major support zones that have held firm during previous corrections. This isn't about predicting a crash; it's about identifying the optimal accumulation zone where long-term conviction overwhelms short-term fear. Think of it as the market's clearance sale before the luxury brand relaunch.
Why This Pain is Necessary
A controlled drop serves a vital purpose. It resets overextended momentum indicators. It allows major players to build strategic positions without immediately driving the price up. Most importantly, it shatters the naive optimism of the 'weak longs'—the kind of investors who panic-sell the moment their portfolio turns red, only to provide fuel for the next leg up. It's the financial ecosystem's ruthless, efficient way of transferring assets from impatient hands to patient ones.
The Path to ATH
Once this key support level is respected—meaning it holds as a floor, not a ceiling—the narrative flips. Failed breakdowns often become the most powerful springboards. With a stronger, cleaner chart structure, renewed institutional interest, and a supply shock from coins moving into stronger hands, the conditions for a parabolic move fall into place. The target shifts from damage control to price discovery.
Of course, this entire thesis assumes the broader crypto market doesn't decide to imitate a legacy bank's risk management strategy—non-existent. One well-timed cynical jab at traditional finance never hurt anyone, except maybe the bankers reading this. The countdown to the dip, and the subsequent launch, is on.
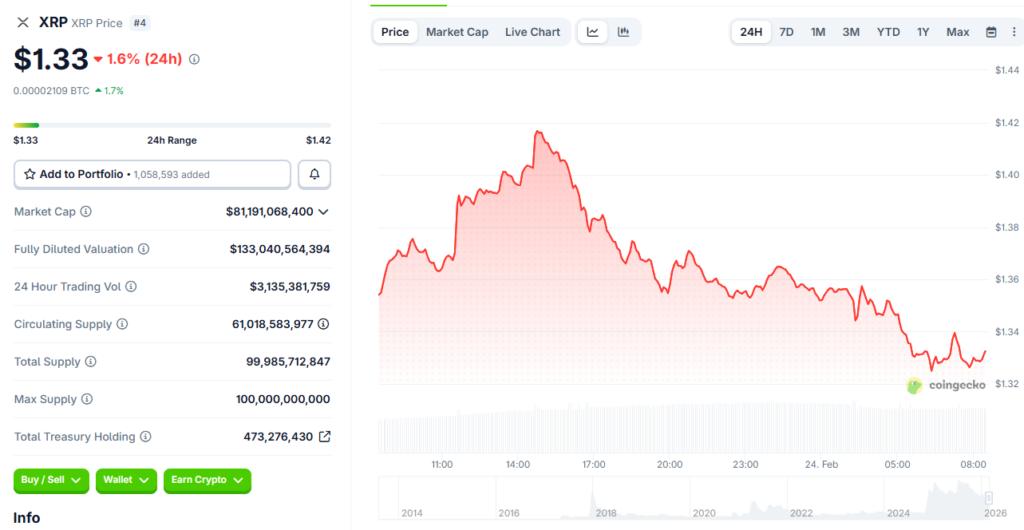 Source: CoinGecko
How Much Could XRP Drop and Which Support Levels Lead to ATH

The Weekly EMA That Keeps Rejecting XRP
A critical exponential moving average on the 1-week chart has shaped XRP’s price action since the token collapsed from its 2018 peak. EGRAG Crypto has followed this level throughout multiple cycles and indicates a trend: each time XRP breaks above this specific EMA in a downward trend and fails, a sharper move downward is the likely result. The specific EMA is not publicly disclosed anywhere beyond his subscriber area, but the trend has been of much focus amongst traders tracking xrp price forecasting patterns at the present time.
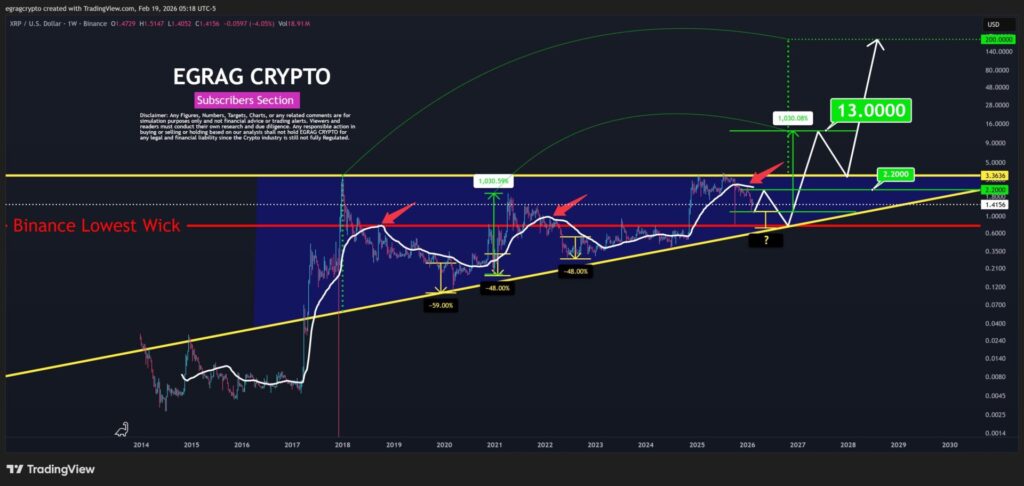
In the current cycle, XRP slipped below the EMA back in November 2025. A recovery attempt in early January 2026 pushed the price up to $2.41, and for a moment it looked like the breakout might actually hold. It did not. XRP dropped to a low of $1.15 on February 6 and has only partially recovered since.
How Much XRP Could Drop and Where the Key Floor Is
EGRAG’s analysis suggests a short-term bounce to around $2.20 is possible from current levels, but he expects another leg down to follow, this time toward $0.78. That level appears on EGRAG’s chart as the “Binance Lowest Wick,” a horizontal support that has held as one of the more significant XRP support and resistance levels across previous market cycles. EGRAG also sees it as the launchpad for a much larger move.
The projected upside from $0.78 is a 1,030% surge to $13, and the historical basis for that XRP price prediction is actually pretty solid. After XRP failed a similar EMA retest in Q4 2018, the token climbed from its lows all the way to $1.96 by April 2021, a move that also measured out to roughly 1,030%. EGRAG believes a similar pattern could play out this time around, with $13 as the next major target after the $0.78 XRP support level gets tested.
The XRP ATH and the Road to $200
The XRP ATH of $3.66 is not the ceiling in this scenario. After reaching $13, EGRAG expects a pullback to around $3.36, a level that lines up with the upper trendline of a symmetrical triangle forming since XRP first started trading. A rebound from there could then carry XRP as high as $200, according to the same analysis.
How much XRP drops in the NEAR term and whether the $0.78 XRP support level holds when it gets there will likely determine how much of this plays out. The XRP price prediction for $13 and eventually $200 covers a long timeframe, and it all depends on that floor doing its job. Right now, the XRP support and resistance levels at $0.78 and $3.36 are the two numbers that matter most, and a new XRP ATH is a long way away either way.
