Dogecoin Charts Signal Potential 20X Rally as Price Eyes Critical Breakout

Dogecoin's technical patterns are flashing bullish signals that could propel the meme coin toward unprecedented gains.
Breaking the Barrier
DOGE approaches a crucial resistance level that, if shattered, might ignite a parabolic move. Historical chart formations suggest this isn't just another pump—it's a potential paradigm shift.
The 20X Catalyst
Traders watch key indicators aligning for a massive breakout. Volume spikes and whale accumulation patterns mirror previous bull runs that delivered exponential returns.
Market Psychology at Play
Retail frenzy meets institutional curiosity—creating a perfect storm for volatility. Though skeptics dismiss it as another 'number-go-up' fantasy, the charts don't lie.
Just remember: in crypto, even the joke coins eventually make bankers nervous—until they quietly buy in themselves.

- Dogecoin trades at $0.2660 with signals of entering a breakout stage.
- Chart patterns mirror past cycles that fueled massive rallies, including the 2021 surge.
- Analysts see potential moves toward $2.28 in the short term and above $5.30 in the long term.
Dogecoin is currently priced at $0.2660, and analysts are closely watching its chart for signs of a new rally. Market observers are of the opinion that the coin is following its earlier boom-bust patterns, and each of those bullish cycles started with subtle accumulation followed by impulsive surging moves.
What is currently transpiring resembles the beginning phase of earlier spikes and is generating enthusiasm among traders.
Javon Marks maintained that if history is to repeat itself, Dogecoin is bound for a rapid surge in gains of over 730% sometime soon, targeting levels of up to $2.28. He also suggested that the big picture might see the coin zoom up to as much as 20 times the price it is now, taking it over $5.30.
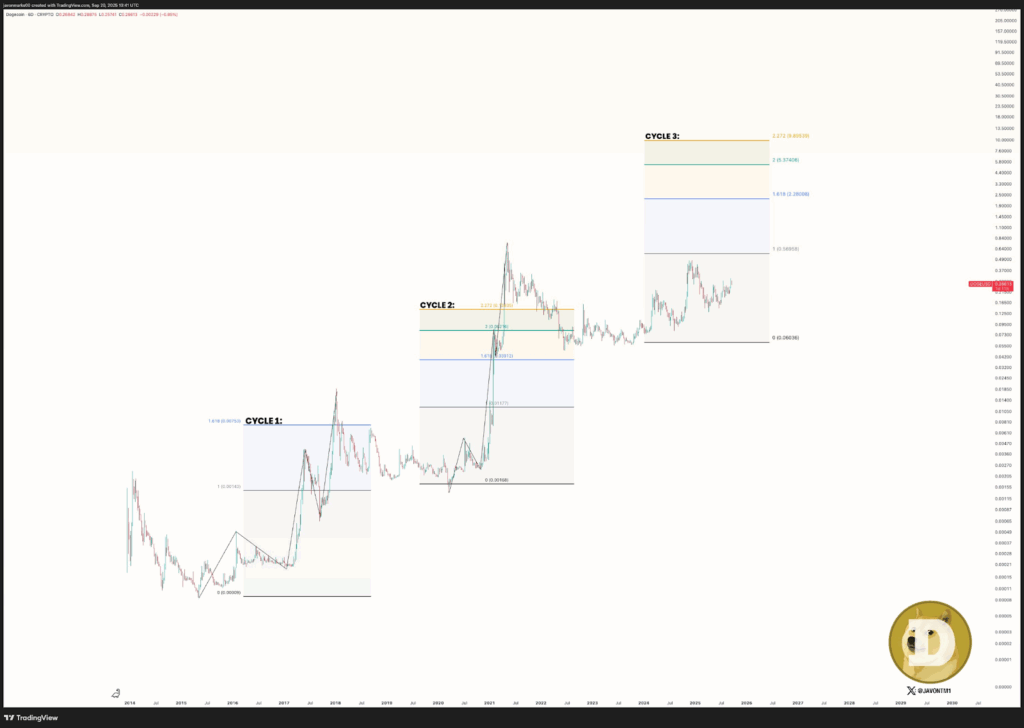
Dogecoin Historical Patterns Hint at Parabolic Moves
Another market voice, known as CryptoElites, noted that Dogecoin’s chart is repeating what happened before past parabolic runs. Each and every cycle, according to him, repeats the same thing. The price is consolidated over months; it breaks out subtly and then spikes into a much larger rally.
In the initial phase, dogecoin rose from sub-penny fractions to a large-scale rally. In the second phase, it reached as high as $0.70+ in the 2021 bull run. Now, with the coin between $0.26 and $0.35, the trend is apparently taking on the “point 2” phase, the precursor before Dogecoin’s greatest surging moves.
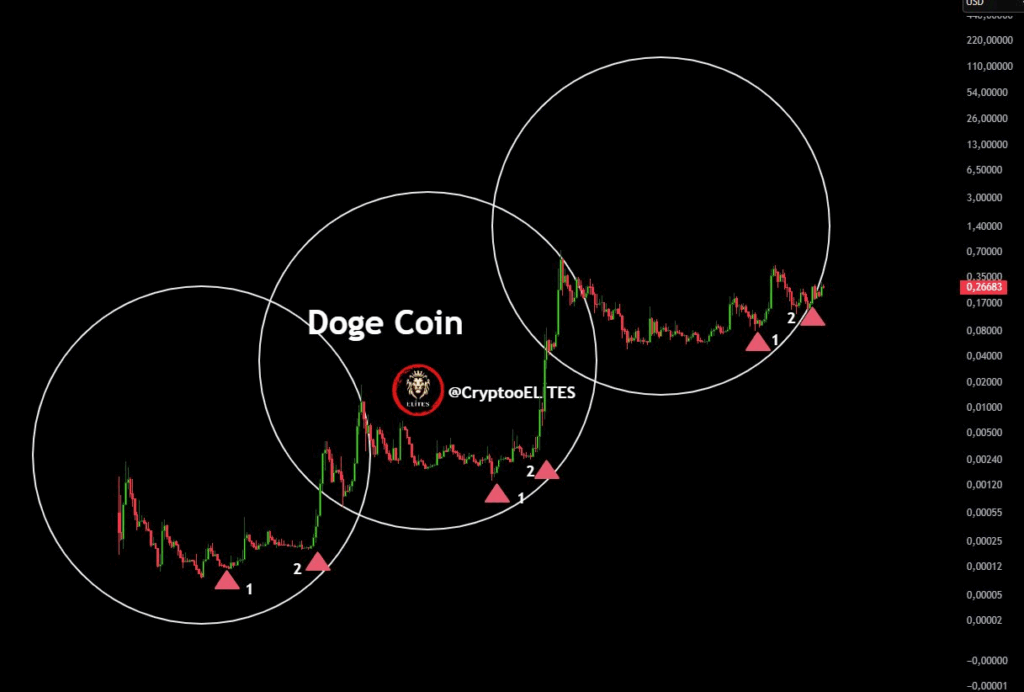
These repeated setups mean that the traders are setting up yet again for an anticipated outburst, and a majority are watching closely for confirmation of the subsequent breakout.
Technical Indicators Show Decision Point Ahead
Besides patterns, indicators are also bullish for a large move. An analyst pointed out the Supertrend indicator, showing that whenever Dogecoin exploded out of the red resistance line, explosive gains followed. Prior rallies resulted in +84%, +194%, and +446% returns. The next breakout might even top +520% if momentum keeps building.
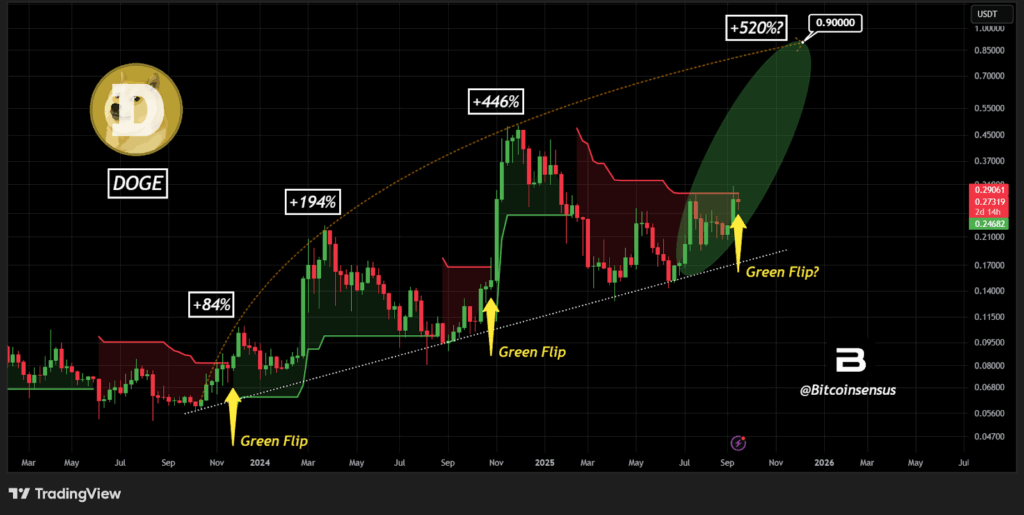
However, one must be cautious. In case Dogecoin fails to get through resistance, it may retest recent lows before it attempts one more time. Overall market conditions, and specifically the Bitcoin trend and cycles of liquidity, will mainly decide up to what extent the rally may go.
Also Read: Dogecoin Eyes Potential Rally With Key Target NEAR $0.30 Resistance
