SOL Price Outlook: Pullback Toward $210 May Precede a Fresh All-Time High

SOL teases a strategic retreat before the next big surge—because what's a crypto rally without a little drama?
Market Mechanics at Play
Solana's native token eyes that elusive $210 support level, a classic 'two steps back, one giant leap forward' maneuver. Technical indicators scream consolidation while traders watch for the perfect entry point. The pattern mirrors historical breakouts—remember when everyone panicked at $150 only to watch it rocket past $250? Classic.
Institutional Whispers
Hedge funds quietly accumulate on dips, because nothing says 'smart money' like buying when retail gets jittery. Meanwhile, blockchain activity hits record highs—NFT mints, DeFi yields, and meme coin chaos fuel network demand. Transaction volumes suggest this isn't just speculative froth (though let's be real, it's mostly speculative froth).
The ATH Horizon
Breaking $210 resistance could unleash a FOMO cascade toward uncharted territory. Shorts get liquidated, leverage flips bullish, and suddenly everyone's a Solana maximalist. But watch those macro cues—because if the Fed sneezes, crypto still catches a cold. Traditional finance types will call it irrational, then quietly allocate 1% of their portfolio a week later.
Final Take: A temporary dip isn't a disaster—it's a discount. Just don't check your portfolio every five minutes.
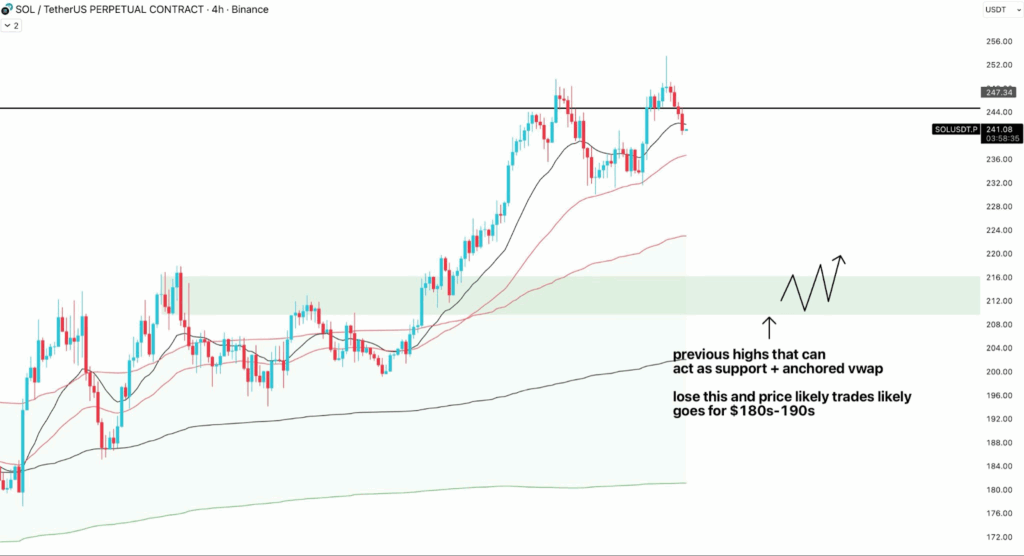
- SOL eyes the $210–$215 support zone, a critical level for potential bullish reversal.
- Failure to hold $210 may trigger a deeper correction, invalidating bullish momentum.
- SOL trades below the 20/50 MAs but remains above the 100/200 MAs, signaling medium-term support.
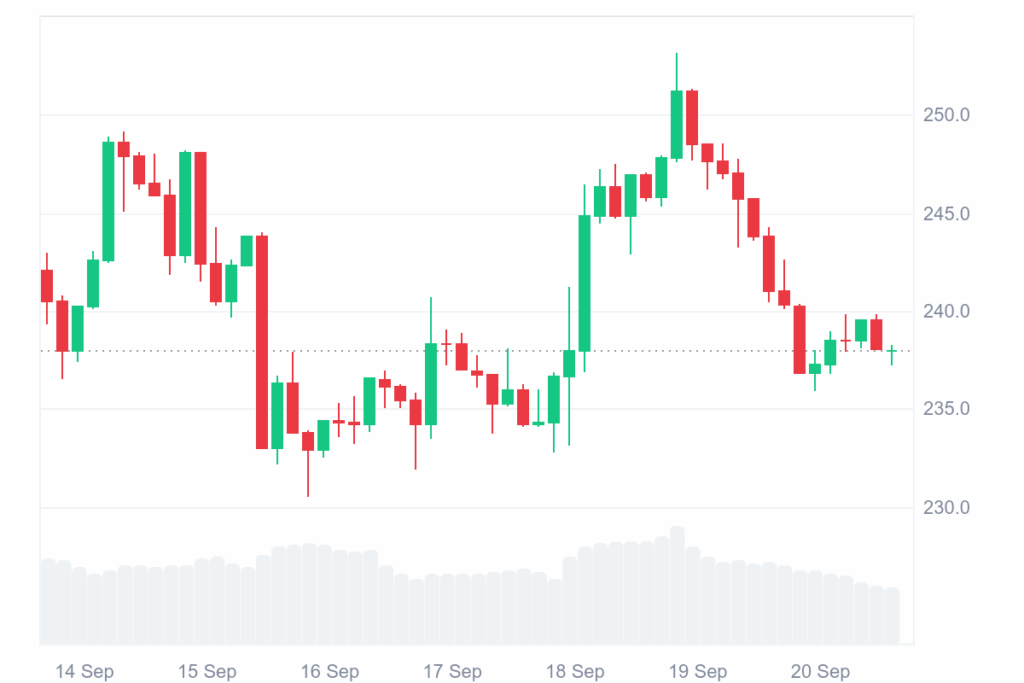
Solana (SOL) is experiencing a downward surge with the aim to touch its key support level as the broader market weakens. The SOL price over the last 24 hours is down by 1.21%, and over the last week it is also down by 1.68%.
At the time of writing, SOL is trading at $237.99 with a 24 hour trading volume of $5.79 billion, down by 33.24% over the last 24 hours. The token has a market capitalization of $129.27 billion, which is also down by 1.19%.
Source: CoinMarketCap
In general, the crypto market trend has cooled, but the major crypto coins like BTC and ETH are struggling to catch a bullish lead. This has also urged the altcoins, but market conditions are highly volatile.
Solana Eyes Critical Support Test at $210 Before Next Rally
The crypto analyst, Crypto Bully, highlighted that Solana’s SOL is gaining trader focus as attention shifts to the $210–$215 range, viewed as a critical bid zone. This area lines up with previous swing highs and the anchored VWAP from recent lows, offering a strong technical confluence that could reinforce support and spark renewed momentum.
Source: X
If the buyer holds a successful defense of this region, technicians anticipate a possible continuation rally back up through Solana’s all-time highs. A definitive breakdown below this area WOULD nullify the bullish formation and threaten near-term upside even as the network growth and ecology fundamentals remain strong.
Also Read: solana Whale Accumulation and Bullish Pattern Spark Rally Hopes
Technical Indicators Signal Weakening Strength for Solana
The price is currently at $238.10, below the short-term moving averages (20 and 50 MA) but above the 100 and 200 MA; the medium-term support is around $226 and $211. Momentum is weakening after a recent peak around $250. The bulls need to recapture the 20/50 MA cluster in order to regain short-term strength.

Source: TradingView
The RSI is at 46.24, and it shows neutral to bearish momentum, while the MACD line (in blue) is below the signal line (in orange) and shows bearish pressure. Overall, SOL is ranging after the recent rally, and a break over $241 might cause a continuation of bullish momentum, but a breakdown below $226 might cause a steeper correction.
Solana Price Performance Indicates Signs of Recovery
Data from CryptoRank revealed that in 2024, the performance was extremely volatile, swinging between sharp gains and steep declines. March surged +60.8%, but April dropped in an instant -37.3%. The year also ended with a strong +41.3% surge in November, followed by -20.5% in December.

Source: CryptoRank
In 2025, the pattern is also variable but less extreme. January was up +22.3%, before sharp losses in February and March (-36% and -15.7%, respectively). For April and subsequent months, most were largely positive, and September peaked at +18.8%.
Also Read: Solana Breaks Key Barriers, Could Explode Toward $457.97
