Cardano Price Surge: ADA Eyes $1.30 as Bullish Signals Flash Green

Technical indicators scream bullish as Cardano's ADA takes aim at the $1.30 resistance level—a target that would mark a significant milestone for the smart contract platform.
Momentum builds behind key support levels
ADA's chart patterns suggest institutional accumulation is underway, with volume spikes confirming genuine buyer interest rather than just retail FOMO. The token's recent consolidation phase appears to be breaking toward the upside.
Market cycles favor altcoin resurgence
With Bitcoin dominance showing signs of weakness, capital rotation into select altcoins like Cardano creates perfect conditions for breakout moves. The $1.30 target represents just the first major resistance—traders are already eyeing higher Fibonacci extensions.
Of course, in crypto, 'technical signals' sometimes just mean 'we found some lines that match our desired narrative'—but this time the patterns actually look convincing. Whether it hits $1.30 or gets rejected like another overhyped ICO, the volatility will be glorious to watch.
- Cardano shows steady growth despite mixed market performance.
- ADA nears crucial resistance, testing investor conviction.
- Technical signals favor short-term bullish continuation.
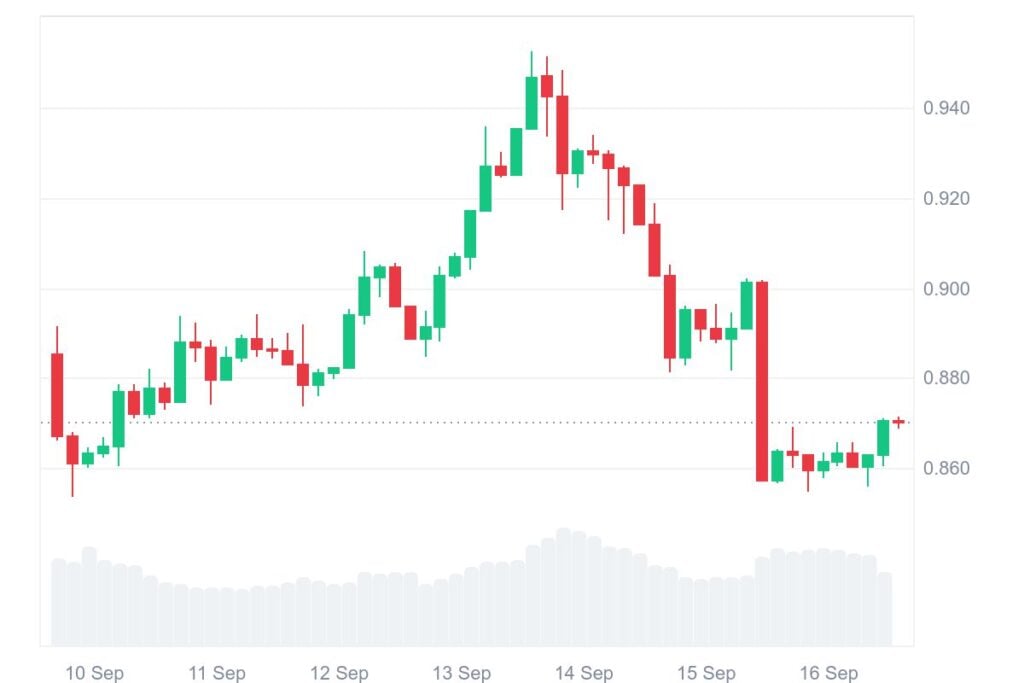
Cardano (ADA) is showing encouraging strength in a mixed market environment. Over the past 24 hours, the token gained nearly 1.61%, while its weekly performance showed a modest 1.59% decline.
At press time, the token is trading at $0.8729 with a 24-hour trading volume of $1.41 billion, marking a 24.81% decline. Despite lower trading activity, ADA maintains a solid market capitalization of $31.11 billion, holding its ground among the leading digital assets.
Adoption Milestone Fuels Investor Confidence
Beyond price movement, Cardano has reached a notable adoption milestone by surpassing 3.125 million holders. This achievement underlines growing confidence in its ecosystem and long-term potential.

Analysts note that rising participation strengthens network fundamentals and could set the stage for further bullish moves. As adoption expands, investors remain focused on whether these milestones can drive the next wave of positive momentum.
Technical Analysis Points Toward ADA Breakout Potential
From a technical perspective, analysts observe that ADA is approaching a decisive zone after weeks of sideways consolidation. The weekly chart shows steady green candles, indicating improving sentiment as buyers attempt to regain control. A crucial support zone has formed NEAR $0.80, consistently protecting against sharper declines.
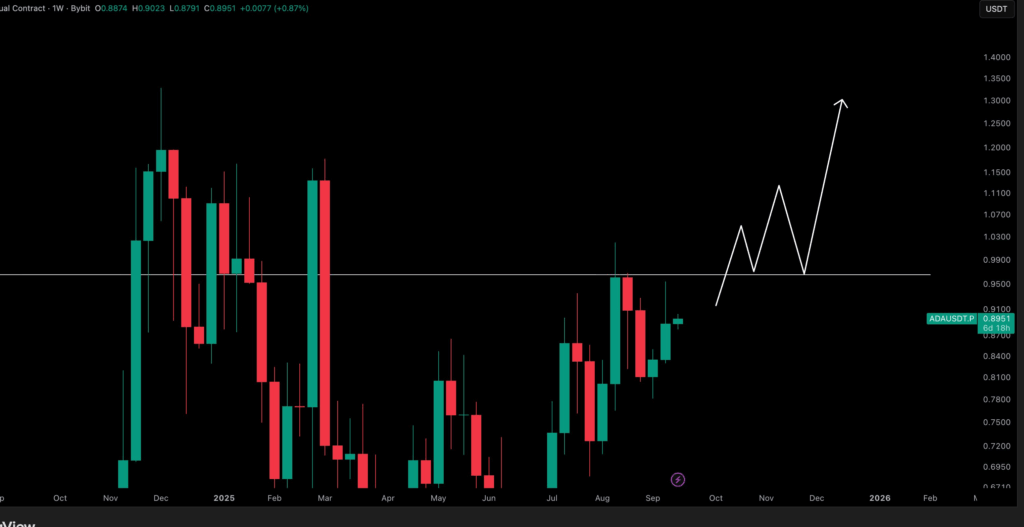
Resistance lies in the $0.95 to $1.00 range, a barrier that once acted as strong support but later flipped into resistance. Recapture of this level will be important in validating ADA’s rising trend. A breakout above the $1.00 level will bring into focus higher levels of resistance at approximately $1.15 and $1.30 and give room to a larger rally.
RSI and MACD Strengthen Bullish Case
Momentum indicators provide further validation of ADA’s bull argument. The Relative Strength Index (RSI) is now standing at 52.08, well above the signal line at 42.37, suggesting a transition from neutral to moderately bullish status.
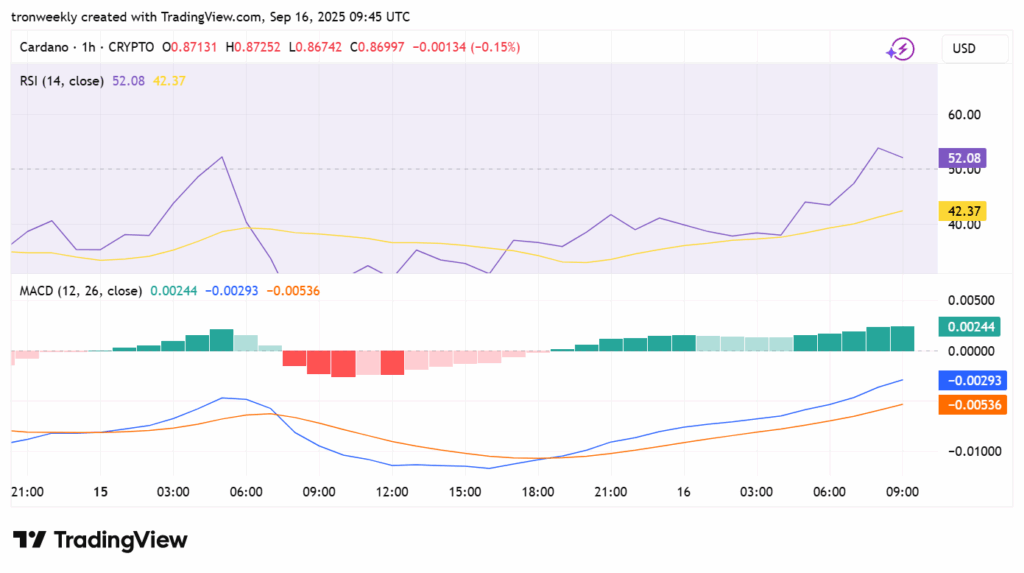
Meanwhile, the Moving Average Convergence Divergence (MACD) has turned positive, and the MACD line crossed above the signal line. The expanding histogram also validates the formation of bullish momentum. However, these indicators suggest ADA will maintain short-term bullish potential if buying remains active.
