🚀 Measurable Data Token Explodes: 171,000% Volume Surge as $0.045 Price Target Looms

Hold onto your wallets—Measurable Data Token (MDT) just pulled off a trading volume moonshot that'd make Wall Street's HFT algos blush. 171,000% spike? That's not a typo, it's a full-blown data economy rebellion.
Price eyes $0.045 like a laser-guided target
While traditional finance still struggles with fax machines and T+2 settlements, MDT's blockchain-powered data marketplace is doing numbers that make 'meme stock' rallies look quaint. The token's recent tear coincides with whispers of major enterprise adoption—though as always in crypto, verify before you ape.
One hedge fund manager was overheard muttering: 'I used to think 10x leverage was risky...'

- MDT’s volume has increased 171,000% along with a significant price breakout.
- RSI and MACD support the fact that MDT has strong bullish momentum.
- Open Interest in trading of MDT futures surged to the levels of over $5 million.
In the last few days, the Measurable Data Token (MDT) has gained a lot of attention in the crypto space. This was after it experienced a 171,000% increase in trading volume. Bullish indicators suggest the token could hit the price of $0.039.
This momentum remains with the price likely to reach the $0.045 resistance level after it has broken critical barriers. Its open interest is also increasing to around the $5 million range.
Measurable Data Token Breaks Key Fibonacci Zones
Measurable Data Token (MDT) experienced a massive change in price movement with a sharp rise toward the $0.045 level. As can be seen in the daily chart of TradingView, MDT moved out of its sideways movement. Then, it skyrocketed past a number of Fibonacci periods.
It rose sharply past the support at the $0.022 level to instantly reach a high of $0.039. This MOVE represents one of its strongest bull runs. These prices were earlier acting as resistance zones.
Also, the Fibonacci retracement zones had been crossed out easily, signifying that there were serious buyers present. The price surpassed $0.0236 and $0.0382 levels, while the zone of $0.0618 was abandoned. The value of the token currently stands at less than $0.045, which may be the next level of resistance.
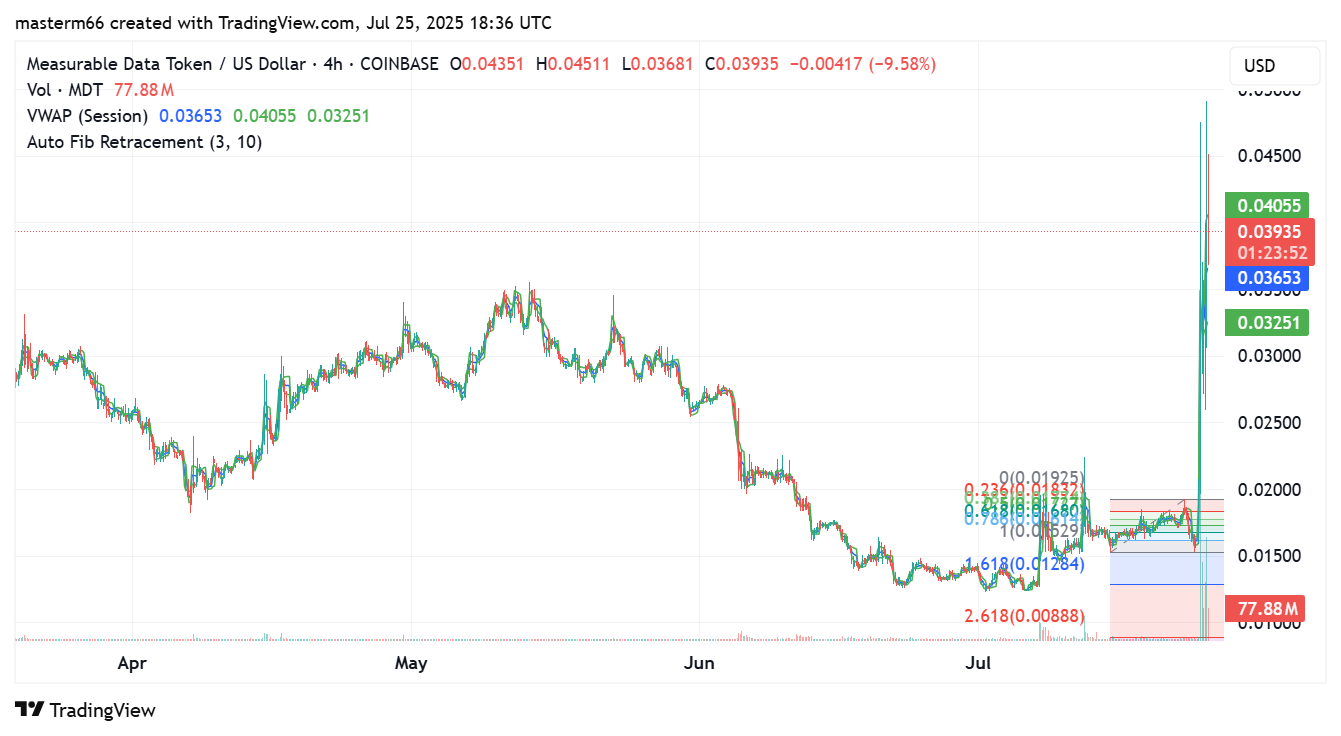
Fib. Source: TradingView
RSI and MACD Indicate More Price Breakouts
The momentum indicators are confirming the bullish direction, showing that pressure is growing in Measurable Data Token. The RSI has overshot the overbought region, which is 70.
This normally reflects a favorable demand, but in some cases may reflect a cooldown on a temporary basis. MACD lines have also been bullish as the blue line is rising above the yellow one.
Moreover, the bars of the histogram are flying up. It is not just that the momentum has changed into the positive, but the surging rate has gone remarkably high. Analysts refer to this MACD signal as an indication that the rise can be prolonged in the coming days.
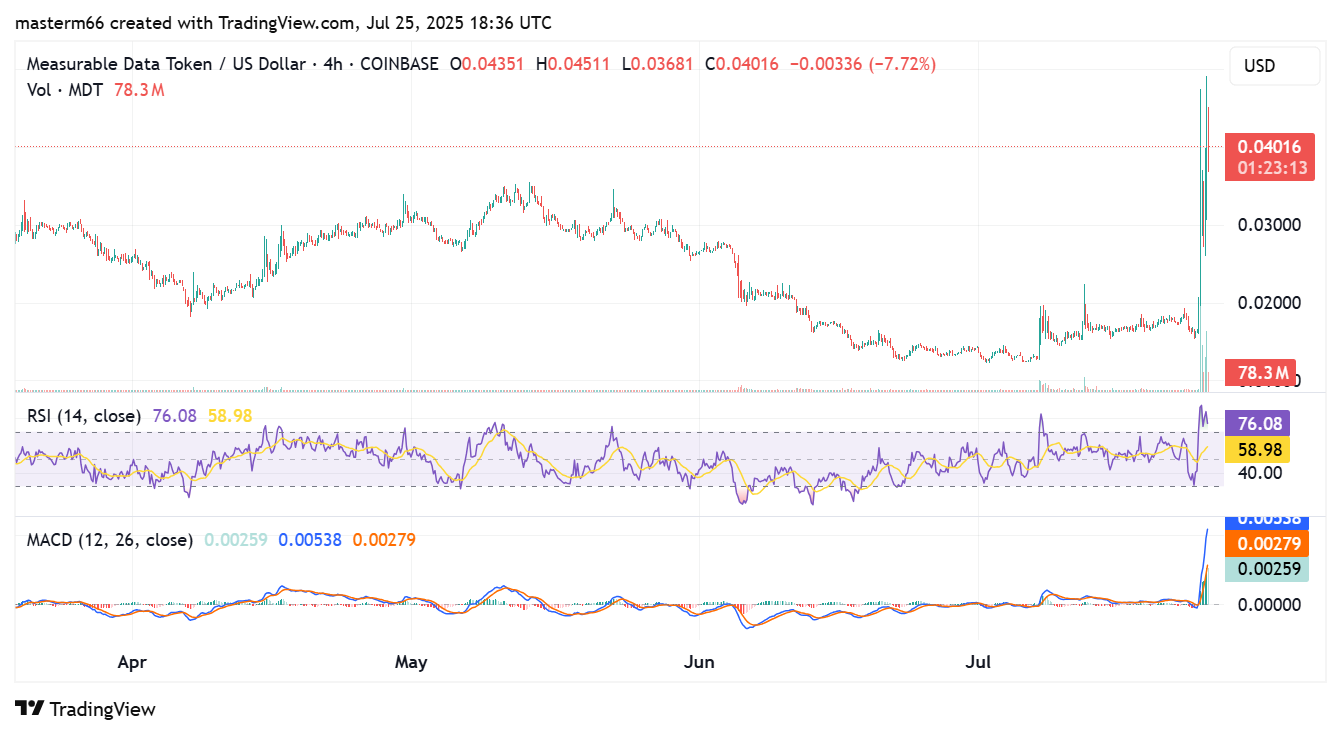
MACD and RSI. Source: TradingView
Measurable Data Token Volume Blasts 171,000%
According to Coinglass, the trading volume of Measurable Data Token has increased tremendously by 174,694.77%, amounting to $289.92 million. Previously, the trading figure of MDT used to be only $40 million annually. Trading on MDT was inactive for many months, and its market incurred very minimal volumes and sideways price movements.
Nevertheless, the breakout has led to the token becoming one of the fastest movers compared to other cryptocurrencies. Analysts are already raising warning signs because of the overheated cues. But most investors remain positive as the tokens continue to target the heights of $0.45 and above.
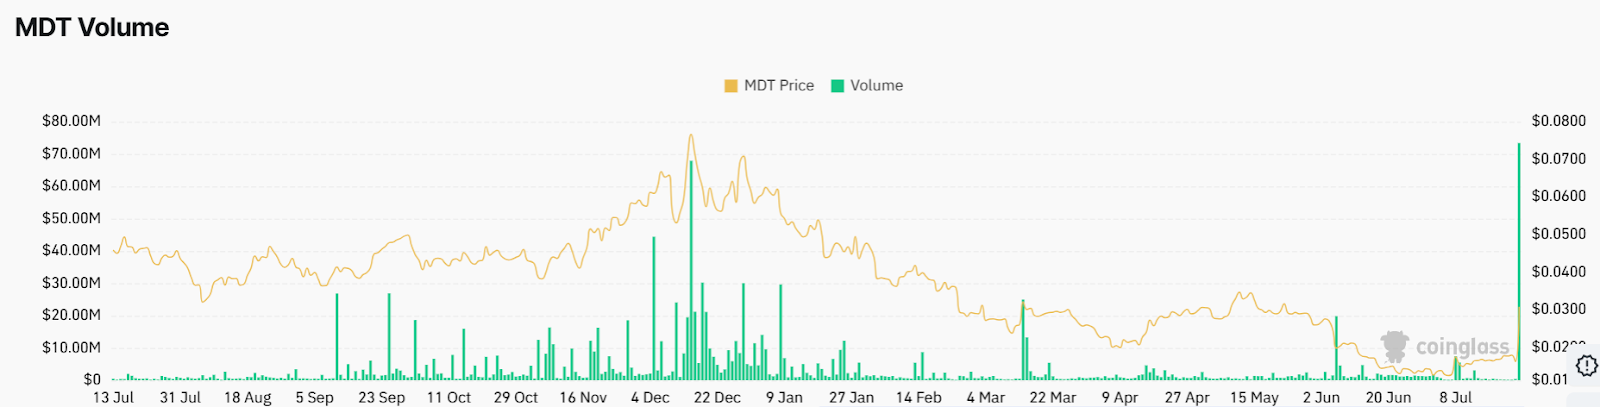
Source: Coinglass
Such a price movement is likely to generate increased attention from speculative traders. However, the possibility of the price gains will be determined by whether the spot and future volume continue to increase. The major factor that will determine the next step for Measurable Data Token is how efficiently it stays above the $0.036 level.
Although there is no official market news as yet, trading activity is strong because traders remain convinced. Currently, the price targets are at the levels of $0.045 and $0.050 in the short-term. In contrast, support zones can be found at the levels of $0.036 and $0.032.
