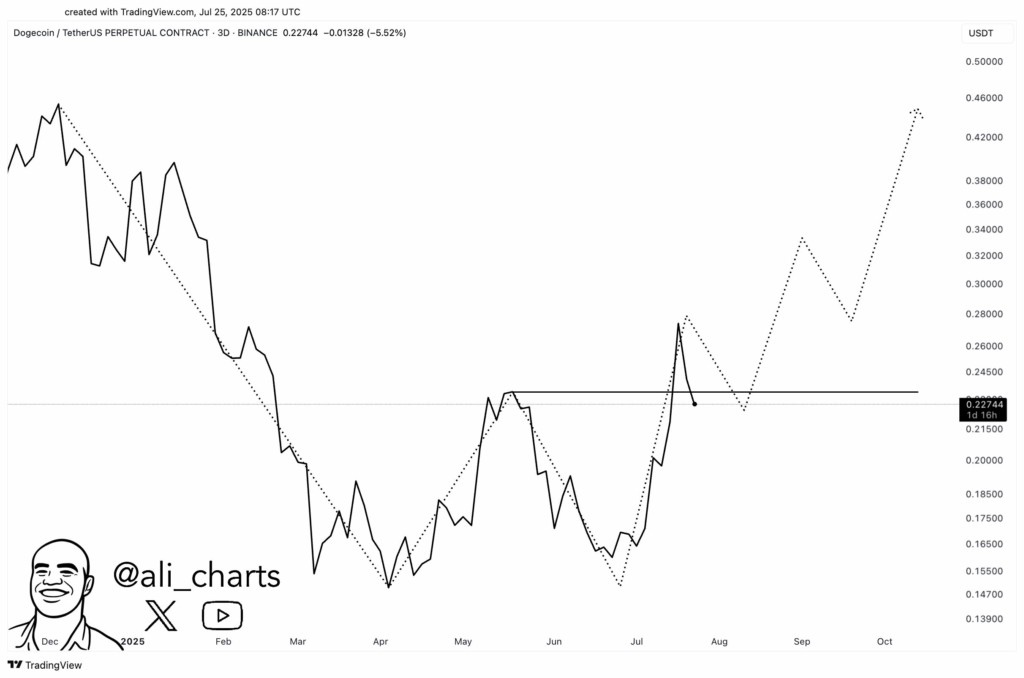
Dogecoin (DOGE) Eyes $0.28 by July End—If Bulls Defend Critical Support

Dogecoin's meme-fueled rally isn't dead yet—but the dogs of crypto need to hold the line.
Key Levels to Watch
DOGE must defend its current support zone to avoid a cascade toward June lows. Break $0.28? That’s when the 'to the moon' tweets start printing again.
Market Psychology at Play
Traders are treating DOGE like a leveraged ETF—swinging between euphoria and despair faster than Elon Musk deletes tweets. The 20% weekly pump suggests gamblers still believe in the dog.
Institutional Whisper
No sane portfolio manager would touch this… which is exactly why retail keeps bidding it. Classic 'greater fool' theory—with extra meme seasoning.
Final Take
DOGE either punches through $0.28 or becomes another 'remember when' crypto story. Place your bets—the casino stays open 24/7.

- Dogecoin (DOGE) holds firm above support despite a 13.73% weekly slide.
- Reclaiming $0.26 could trigger a rally toward $0.46.
- Indicators show accumulation and fading selling pressure.
- Bullish momentum still intact above key moving averages.
Dogecoin is showing early signs of a possible rebound. crypto trader Ali pointed to a double bottom formation and suggested that this is the level where a turnaround could begin. If the coin can flip $0.26 into support, the next move could take it closer to $0.46.
DOGE is currently trading at $0.2359 with a slight daily gain of almost 2%. On the weekly chart, however, it’s down 13.73%, reflecting the recent correction from its local high. Despite the pullback, the setup doesn’t yet point to a full trend reversal. Instead, it looks more like a pause, with traders watching for confirmation of a bounce.
Moving Averages Still Supportive
The weekly chart paints a clear picture. Dogecoin was recently rejected near $0.28, a zone that has blocked upward moves before. Even so, the price remains above all major moving averages: the 20, 50, 100, and 200 EMAs. That’s a strong sign that the longer-term trend is still leaning upward.
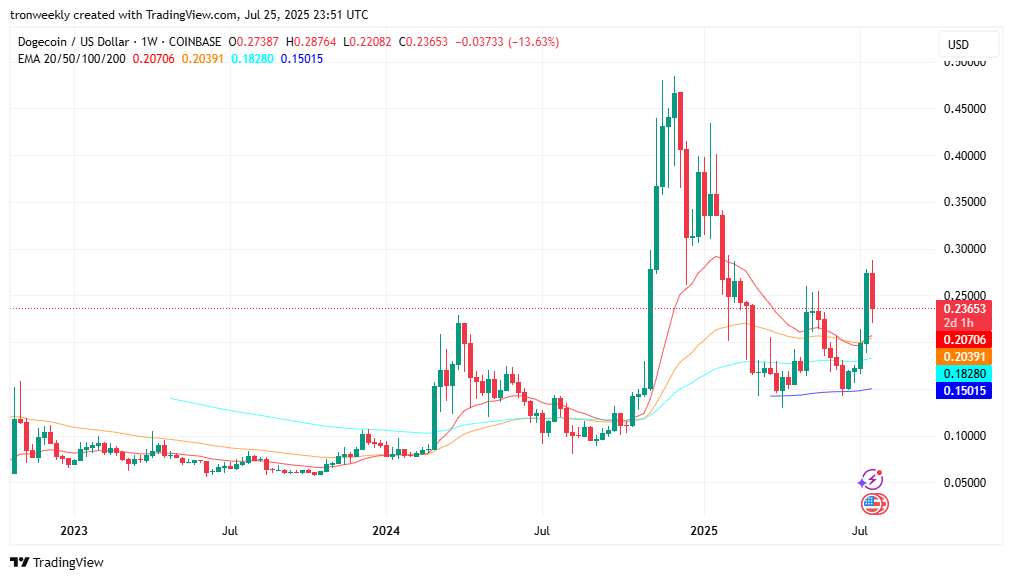
Support currently sits between $0.20 and $0.21, aligning closely with the 20 and 50-day EMAs. As long as DOGE stays above this band, the pullback could be viewed as healthy profit-taking rather than a breakdown. The resistance area at $0.28–$0.30 remains the main barrier to watch in the NEAR term.
Buying Pressure Gains Ground
Most indicators support the case for a potential rebound. The Relative Strength Index (RSI) is currently at 54.13, still in bullish territory but slightly down. It signals fading strength but leaves room for further upside before any overheating.
On the MACD, there is a bullish crossover, a formation common at the beginning of price upsurges. Although histogram bars are decreasing, indicating diminishing momentum, they remain on the bullish side.
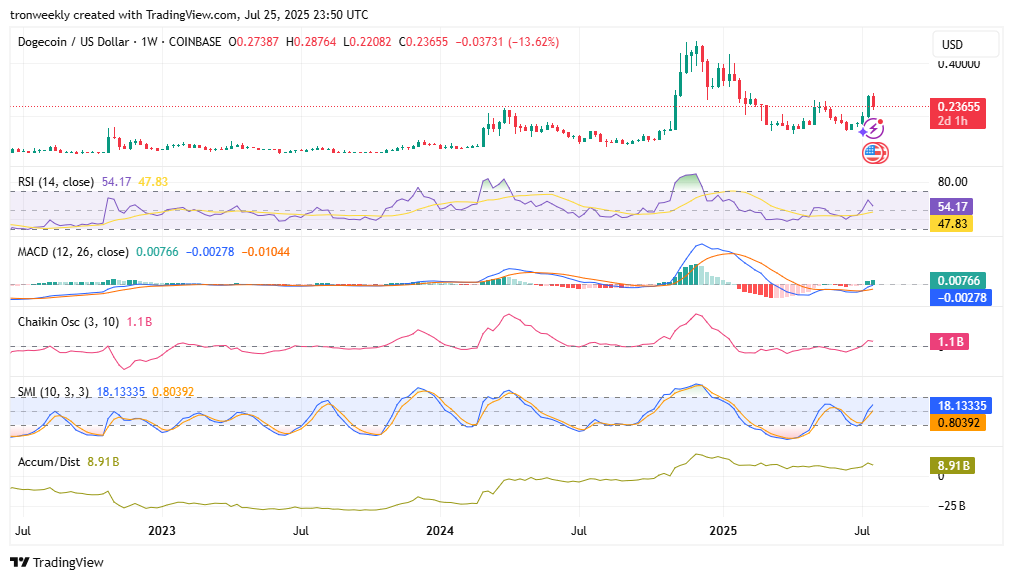
The Accumulation/Distribution (A/D) line is still at 8.89 billion, indicating persistent buying pressure. Also, the Chaikin Oscillator is still bullish at 1.09 billion, again verifying that buyers dominate sellers. Even the Stochastic Momentum Index indicates a strong bullish crossover, although it can be subject to short-term fatigue soon.
July End Forecast For Dogecoin
From current trends, Doge is more likely to reclaim $0.24 and again target the $0.28 area. Such a bullish strategy depends on staying above the $0.21 support line. If it falls below that, bulls may switch the configuration to a bearish mode, sending the price towards $0.19.
But for the moment, indicators are leaning towards steady building and diminishing selling pressure. So long as support holds good and purchase demand persists, a test of loftier levels is still probable. Breakout above $0.26 WOULD provide an indication of a more robust bounce for the balance of July.
