Ethereum Hits $3,595: Brace for a Explosive Surge to $4,270?

Ethereum's price just punched through $3,595—fueling speculation that a rocket ride to $4,270 is next. Traders are circling like sharks, but will the rally hold?
Technical breakout or bull trap? The charts scream momentum, but remember: crypto moves faster than a hedge fund manager dodging accountability. ETH's next move could define the summer.
One thing's certain: if this breakout sticks, the 'I told you so' crowd will be louder than a Bitcoin maximalist at a dinner party. Buckle up.

- Ethereum trades at $3,595, showing a slight dip, but has seen a 7.29% gain over the past week.
- RSI has breached its downward trend line, signalling a possible breakout above the $3,680 resistance.
- A breakout above $3,870 could push Ethereum towards $4,502.78, with further upside potential to $5,623.54.
As of press time, ethereum (ETH) is trading at $3,595 and has fallen by 3.58% in the last 24 hours. The same period trading volume is recorded at $39.13 billion, a drop of 0.13%. The price of the ETH coin has gone up by 7.29% in the last 7 days.
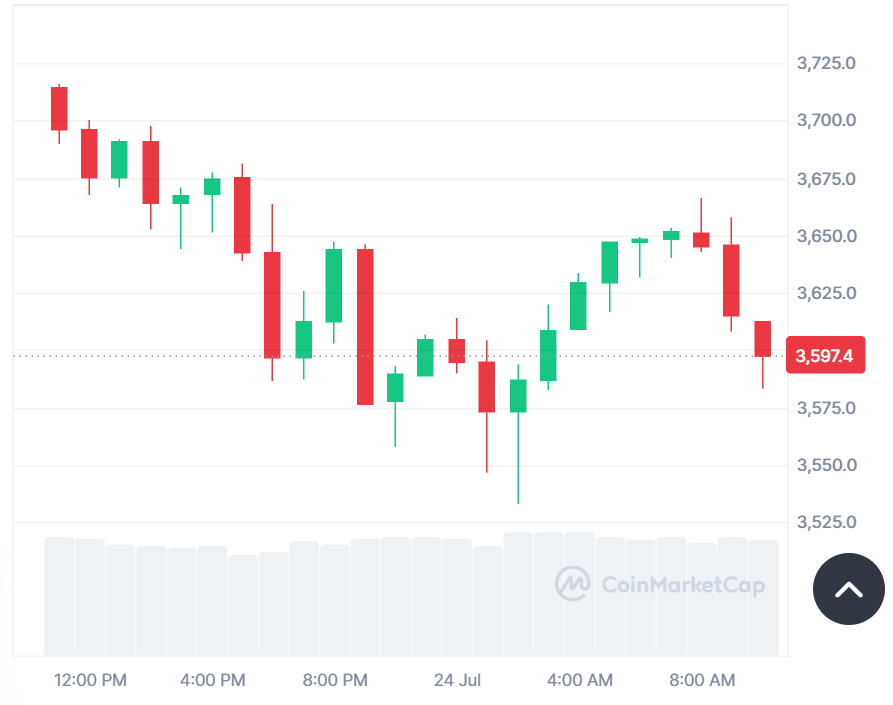
Source: CoinMarketCap
Ethereum Approaches Key Resistance
Analyst BigMike has highlighted that the Relative Strength Index (RSI) of Ethereum is on the brink of breaking out. The RSI has now breached its trend line going down, and ETH is about to turn the yellow exponential moving average (EMA) into support. BigMike is proposing that Ethereum may break the resistance at $3,680 and begin its wave 5 of wave 3. In the short term, his price target for Ethereum is between $4,270 and $4,300.

Source: X
ETH is approaching a major supply area around $3,870, where the cryptocurrency has historically served as a significant resistance point. Marzell Crypto mentioned that a slight retracement might take place, causing ETH to reach the 0.618 Fibonacci retracement point at $2,797. After this retracement, Marzell expects a possible breakout, and ETH might move up. ETH has to clear the $3,870 resistance to experience a potentially significant upward move.
After breaking out of this important resistance, the initial major target will be at $4,502.78. Should the momentum be sustained, ETH has the potential to hit up to $5,623.54. A weekly close above the $3,870 and $3,900 area WOULD validate the move and generate additional purchases.

Source: X
The RSI is 39.87, which indicates a neutral market. The RSI pattern implies consolidation, but it may also imply the onset of a breakout. The MACD stands at -3.49, and the signal line is -15.85. The MACD histogram, which indicates the difference between the MACD and the signal line, is now -19.34. This indicates the short-term bearish momentum.
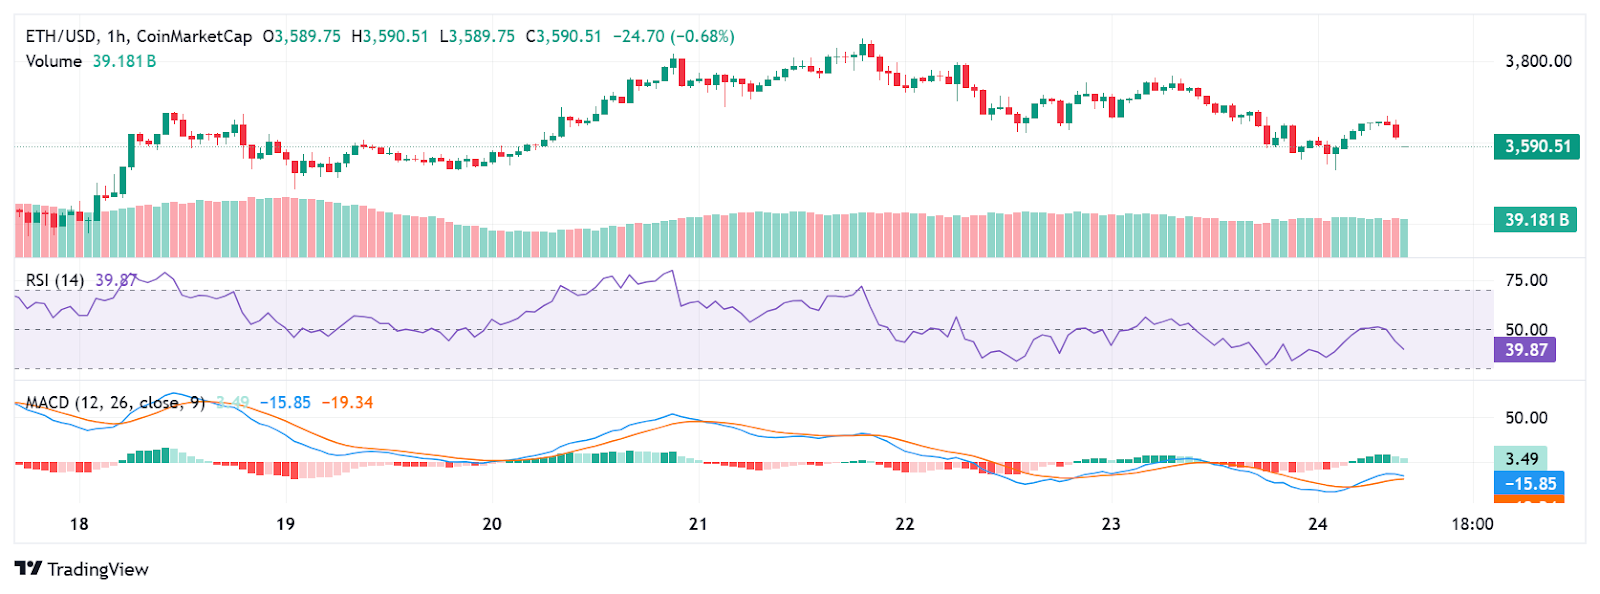
Source: TradingView
Ethereum Faces Short-Term Bearish Signals
CoinGlass data shows that the volume decreased by 4.06% to reach a level of $124.46 billion. The open interest has also decreased by 5.55% and is currently at $53.26 billion. The ETH OI-weighted funding rate is 0.0120%, reflecting a marginal market contraction.

Source: CoinGlass
The recent price movement of ETH indicates a possible breakout, with fundamental resistance points set at $3,870 and $3,680. Short-term bearish signals are present, but the long-term prospects of ETH are still bullish, and a robust breakout past these could drive ETH to new heights.
