Bitcoin Teeters at $120K: Make-or-Break Moment for Bulls as Resistance Looms

Bitcoin's grinding ascent faces its ultimate stress test—a razor's edge dance with the $120,000 resistance level. Will institutional FOMO fuel the breakout, or trigger a brutal liquidation cascade?
The Decisive Battle
Market structure screams volatility. Whales accumulate while derivatives traders pile into leveraged positions—classic setup for a violent resolution. Technicals hint at exhaustion, but remember: Bitcoin loves to humiliate both bulls and bears at key psychological levels.
Institutional Wildcard
BlackRock's ETF inflows show no signs of slowing, creating a bizarre duality: spot demand props up price while futures open interest reaches dangerous levels. Someone's getting squeezed—the only question is which side bleeds first.
Cynical Take
Wall Street still can't decide whether to ban crypto or front-run retail. Meanwhile, Bitcoin does what it's done for 16 years: ignore the noise and follow its own chaotic rhythm. Place your bets—just don't pretend you know how this ends.

Bitcoin has maintained strong price action so far, moving in a positive direction. It is currently trading NEAR all-time highs of $118,707, but the market is also wary.
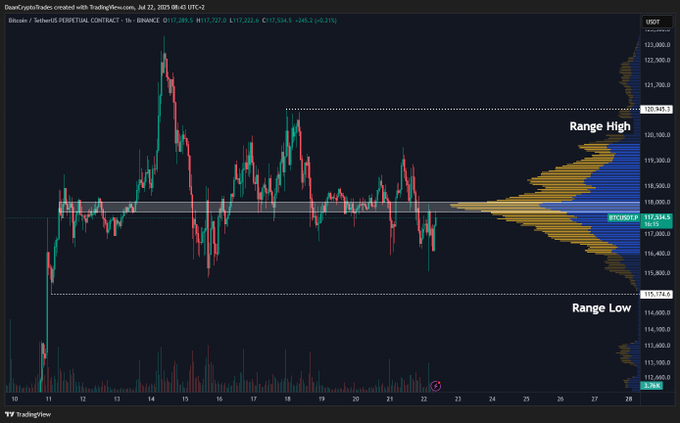
Crypto analyst Daan Crypto Trades highlighted that Bitcoin is continuing to trade within a tight range, with the majority of the volume concentrated at the $118,000 level. It is an important support and resistance level; it is also important to watch this area.
Source: X
The price fluctuations of the recent past of bitcoin from after mid-June to the end of July are volatility. Bitcoin has been able to board major support levels despite the continual fluctuation in price. This indicates that it is doing well, and thus there can be more profit.
Bullish Momentum Holds at Key Support
The market is currently anticipating necessary consolidation around the 118,000 mark, after BTC was consolidating there during the last days. It may either be followed by a breakout or a minor pullback depending upon the market behavior at this decisive moment.
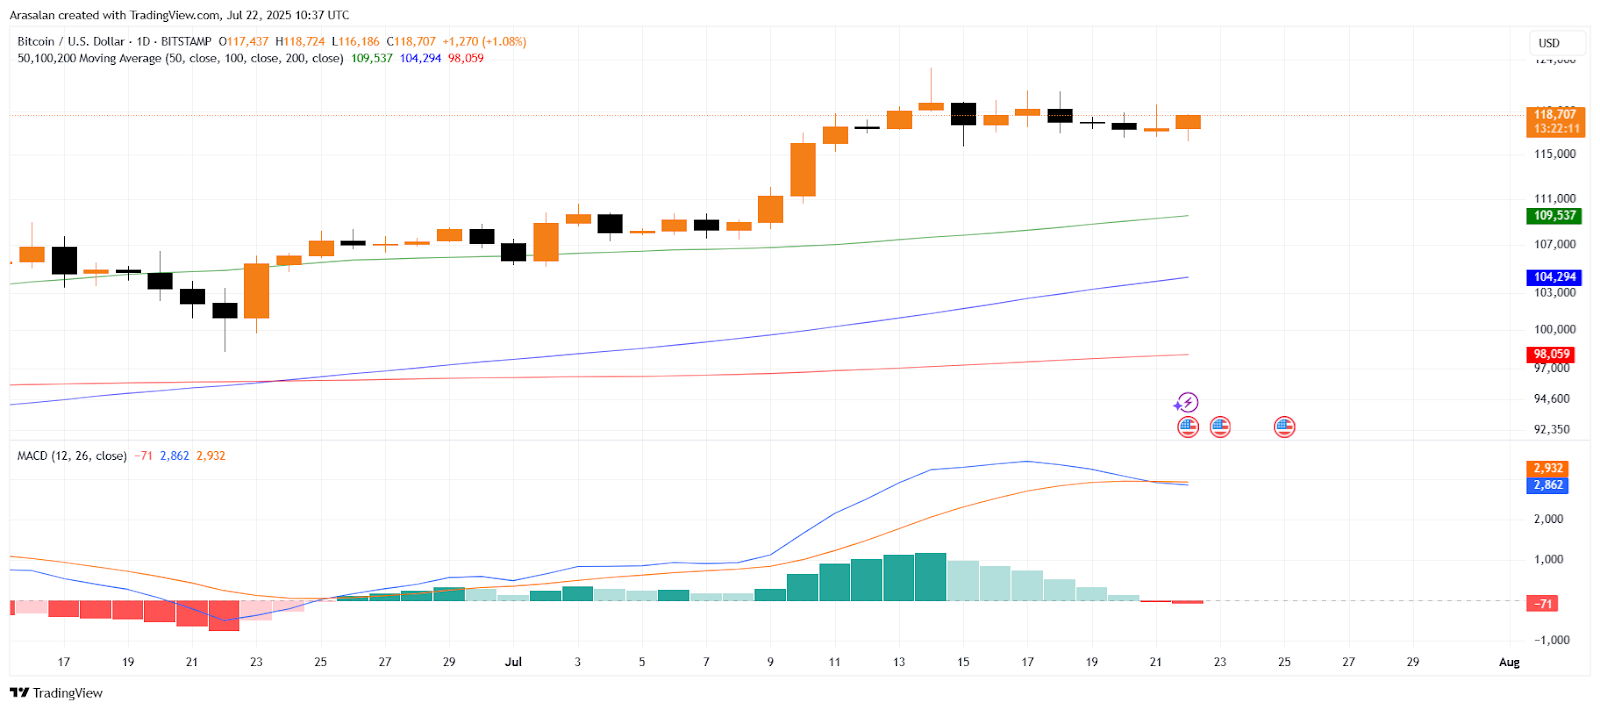
The bullish trend of Bitcoin is indicated by its price and the levels of the important moving averages. The 50-day simple moving average, represented by a green line on the chart, has been holding the price.
Bitcoin has also been trending higher to the 100-day (blue line) and 200-day (red line) moving averages, contributing to its bullish aspect. The market is, however, in a nervous state to see if there is a trend reversal or if there is consistent continuity.
The Moving Average Convergence Divergence (MACD) indicator indicates that the current trend of BTC is positive. However, bullish momentum is somewhat weaker, as the MACD histogram has decreased by 2,932 to -71.
This drop is an indication of a potential near-term correction. Traders need to be aware of the change in momentum since there might be signs of halting the rally of BTC or even a decline in it.
Source: TradingView
Another factor that is of significance is the Relative Strength Index (RSI), which stands at 71 at present. The RSI is near to the overbought zones, which implies that Bitcoin may be reaching the top.
Consequently, a pullback or a short-term consolidation is possible, given that BTC will test some important resistance levels. There might be some corrections to the uphill trend made by the market.
Bitcoin Targets $120K: Will It Surpass $125K?
It is in the short-term resistance that the currency is moving to levels of around $118,000 per coin. By overcoming this imperfection, the cryptocurrency may target the next resistance at $120,000.
This may pass over the limit of $120,000, causing BTC to surge past the mark to attain or surpass the level of $125,000. However, in case the market cannot sustain this trend and turn upwards any more, it may collapse to the $115,000 point, a point that provides the support needed.
In the short-term Bitcoin depends on support. In case the price falls below the level of $115,000, the second significant support zone will be the 50-day moving average at the level of $109,537.
This trading level will be vital that Bitcoin to sustain to continue with the bullish trend. A break below this support might be the sign of a more extended retreat, which will bog down the rally.
Although there is a possibility of short-term corrections, BTC is doing well in the long term. BTC WOULD potentially be able to reach even higher as long as it maintains momentum by staying above the vital support positions.
The traders are recommended to pay close attention to the area of $118,000 to $120,000 as these are the levels that will most probably define the future direction of the market regarding BTC.
FAQs
It’s a major support and resistance zone where most of the trading volume is concentrated. A breakout or rejection here could define Bitcoin’s next major move.
Yes, Bitcoin remains bullish as it trades above key moving averages like the 50-day, 100-day, and 200-day SMAs. However, momentum indicators suggest a possible short-term correction.
The RSI is at 71, close to the overbought zone. This means Bitcoin could face a short-term pullback or consolidation before continuing upward.
If BTC breaks above $118,000, it could target $120,000 and potentially $125,000. Failure to hold could drop it to $115,000 or even $109,537.
