Bitcoin’s Next Stop: $136K? Smashing Through $118K Could Trigger a Mega Rally

Bitcoin's knocking on the door of history—again. After months of sideways action, the king of crypto is eyeing a potential breakout that could send shockwaves through Wall Street's spreadsheet jockeys.
The $118K Litmus Test
Clear this resistance level, and the path to $136K opens up like a Wall Street bonus season. Technicals suggest momentum is building, but as always in crypto-land, nothing's guaranteed—except volatility.
What's Driving the Charge?
Institutional FOMO meets retail speculation in this perfect storm. While traditional markets grapple with inflation concerns, Bitcoin's playing its usual role as the rebellious alternative asset—proving once again that digital gold shines brightest when fiat currencies sweat.
One cynical truth remains: whether Bitcoin hits $136K or crashes back to earth, the only sure winners will be the exchanges collecting fees on every manic trade.

- Bitcoin trades at $117,505 with a 0.69% gain as volume jumps 18.92% to $73.52 billion near resistance.
- The RSI at 47.90 reflects neutral sentiment, while the MACD shows a weakening trend with a histogram reading of a negative 34.87.
- A breakout above $112,000 confirms the price discovery phase, with Fibonacci targets at $121,000, $128,000, and $136,000.
At the time of writing, Bitcoin is trading at $117,505 with a 0.69% increase over the previous 24 hours. The daily trading volume rose by 18.92% to $73.52 billion. The weekly performance is also modest with a gain of 0.46%. Although the direction is clear, the price action is hesitating at the resistance level. Market indicators show cautious Optimism among traders.
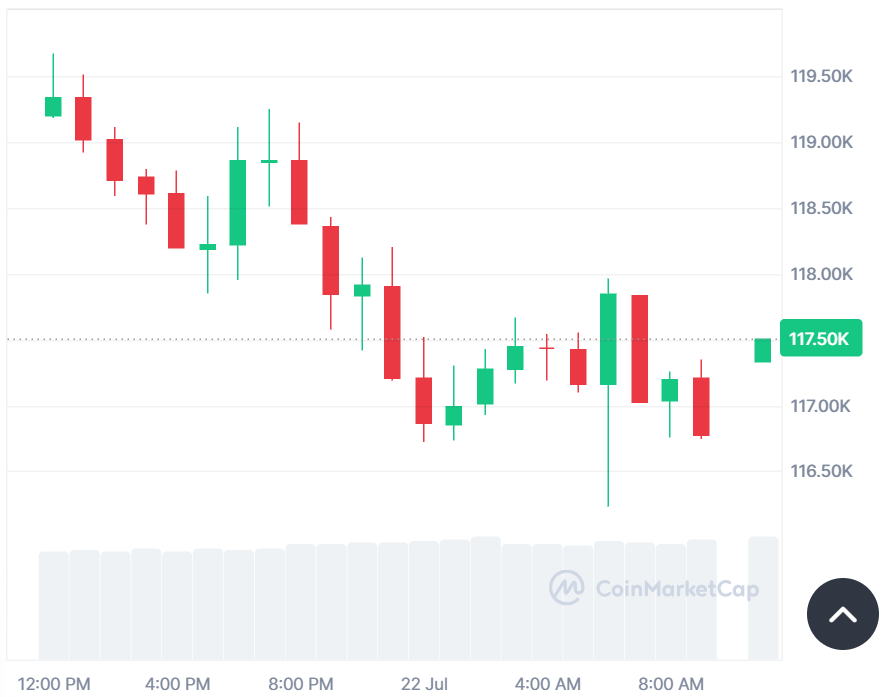
Source: CoinMarketCap
CoinCodeCap Trading highlighted that Bitcoin has risen above the mark of $112,000. This validated a channel breakout in a sideways direction and started a price discovery period. New Fibonacci targets are at a price of $121,000, $128,000, and $136,000. Support levels are located at $100,000 and $90,000. The resistance point is recorded at $120,000 and $150,000.
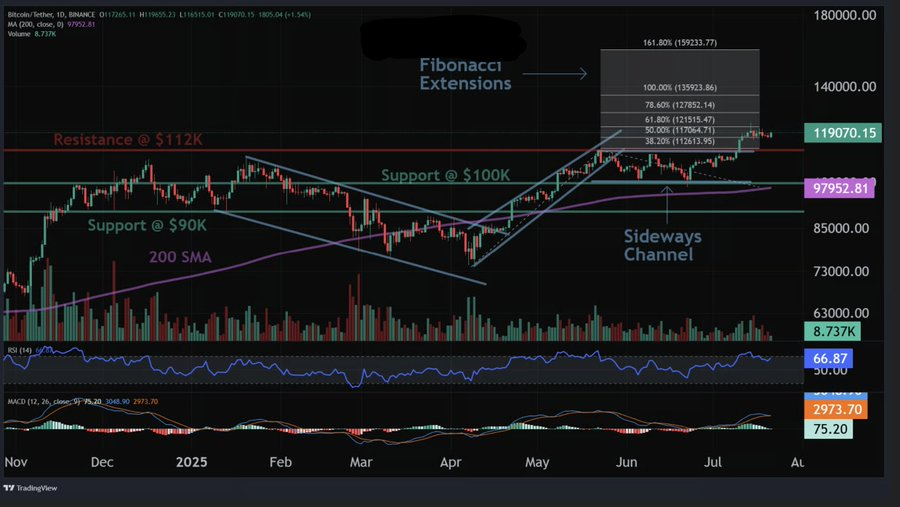
Source: X
Technical Indicators Weakening
The Relative Strength Index (RSI) is at 47.90 in the hourly chart. This puts bitcoin in a neutral position. An RSI under 50 revealed that the market has no strong momentum. Traders have not been convinced decisively in either direction. A break above 50 may swing the odds back to buyers. Until that point, there will be lateral price movements.
MACD indicates the fading momentum. The MACD line stands at -280.33 and the signal line stands at -245.46. The histogram indicates a negative value of -34.87. These figures suggest a decline in bullish momentum. If buyers do not gain traction, the trend might be paused. Should the pressure persist, it may be a bearish crossover.
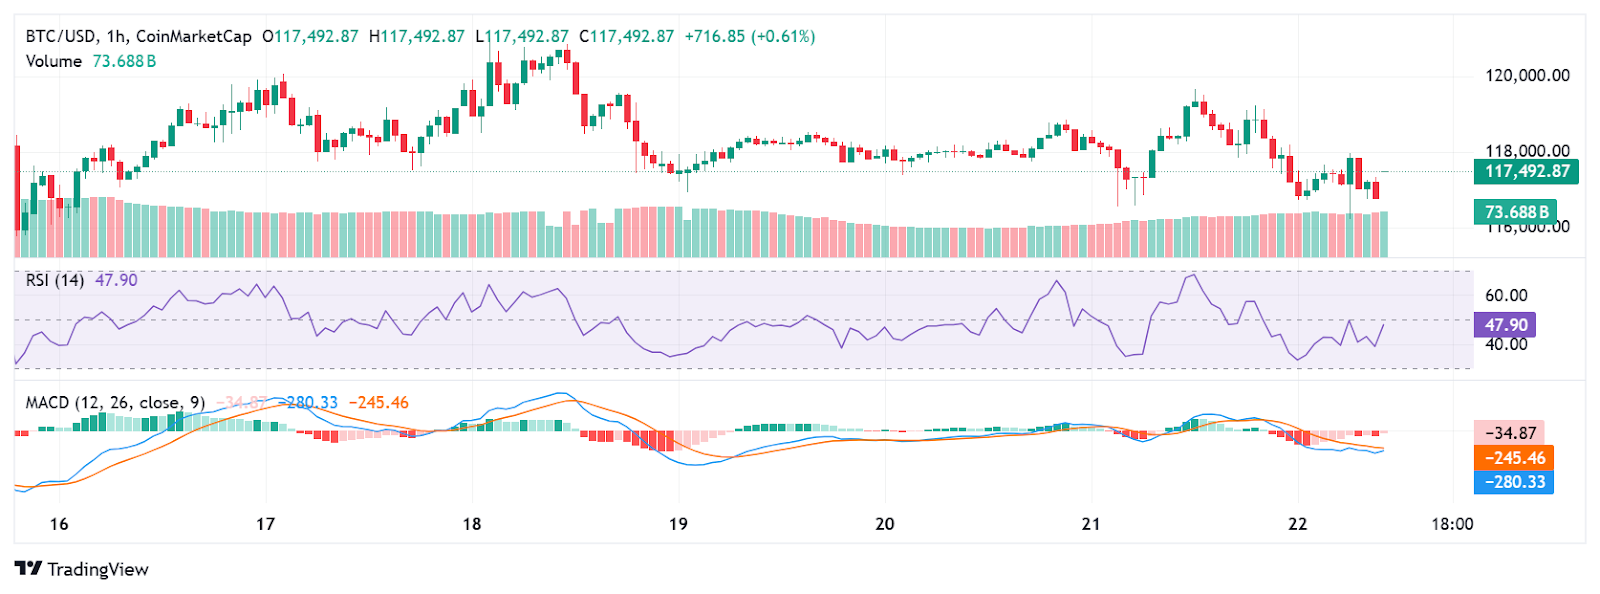
Source: TradingView
According to CoinGlass data, the trading volume ROSE by 43.98% to $102.33 billion. The open interest decreased moderately by 0.29% to $84.75 billion. This is an indication that traders are protecting profits or hedging. The OI-weighted funding rate is at 0.0111% which indicates that a slight long bias exists.
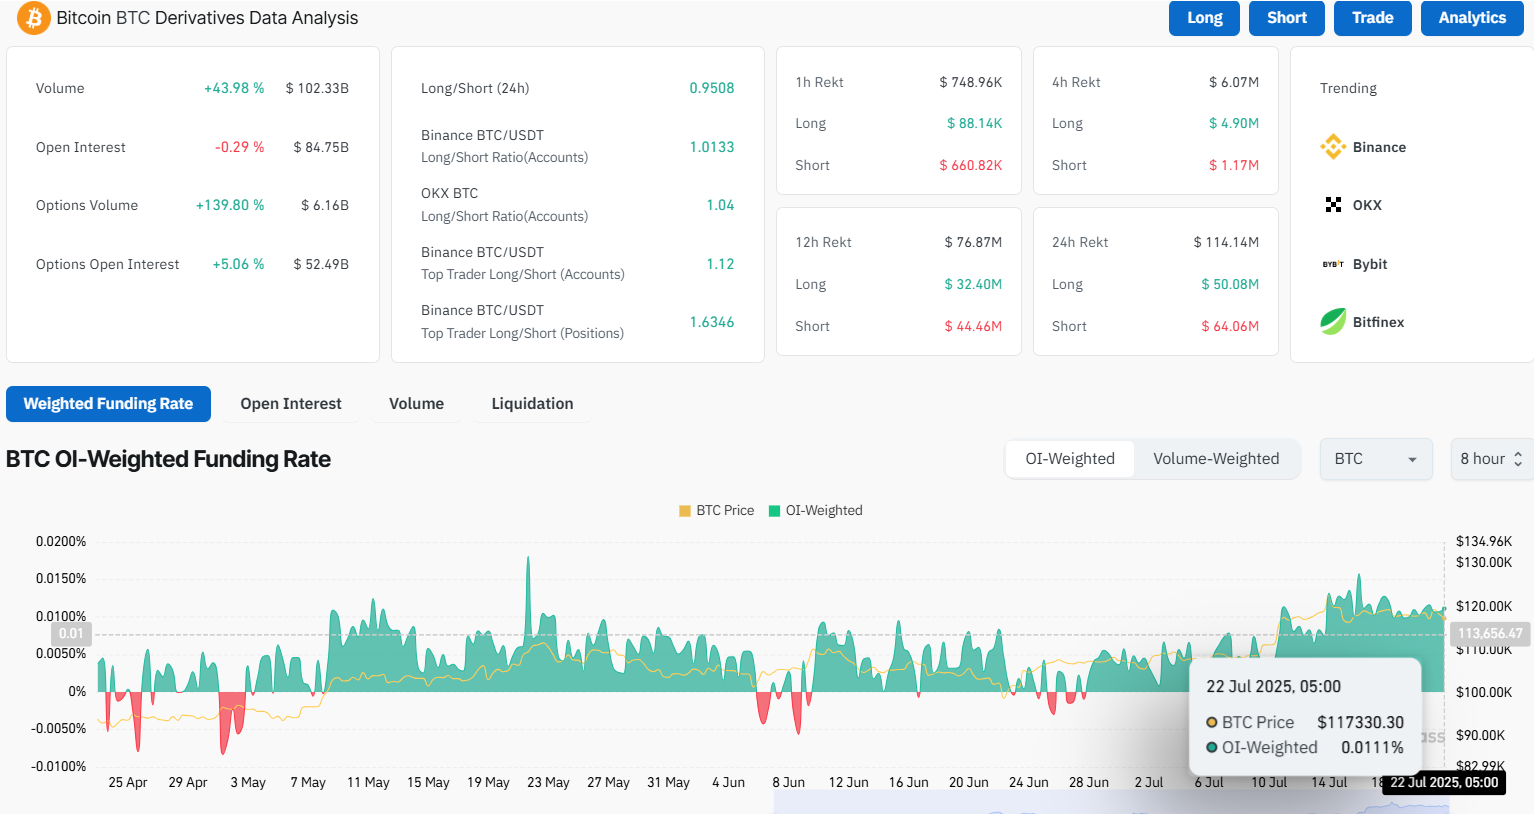
Source: CoinGlass
Bitcoin at Crossroads
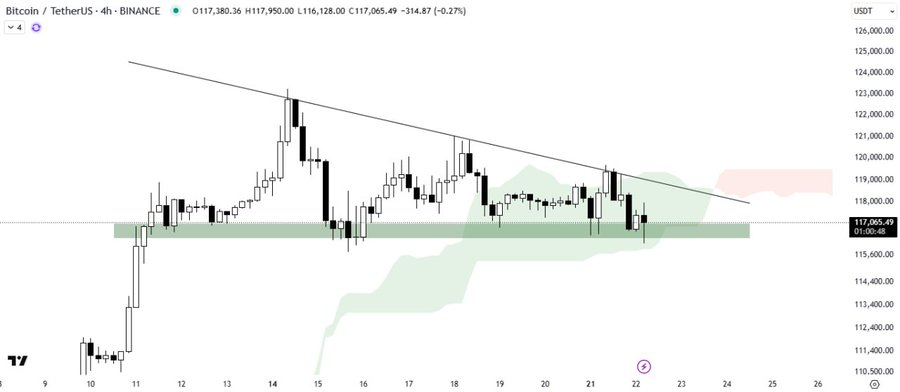
The crypto Express revealed a descending triangle taking shape on the chart. Bitcoin remains well above an important demand area. The price rests within the Ichimoku Cloud as well. This shows a lack of short-term direction. A bullish continuation could be confirmed in a breakout above the cloud. A breakdown may create new selling pressure.
Source: X
The immediate future of Bitcoin relies on action at the level of about $118,000. A break of this level can initiate more gains, up to $121,000 and more. Any inability to maintain existing support will push prices downward. MACD and RSI should be followed carefully by traders.
The market is data-driven as Bitcoin shifts between pressure zones. Volume, interest, and technicals indicate a slightly cautious but spirited trading environment. Not much dominance as yet. The next MOVE will depend on the price reaction at the resistance level.
